Samsung SSD 840 Pro (256GB) Review
by Anand Lal Shimpi on September 24, 2012 7:00 AM EST- Posted in
- Storage
- SSDs
- Samsung
- Samsung SSD 840
Random Read/Write Speed
The four corners of SSD performance are as follows: random read, random write, sequential read and sequential write speed. Random accesses are generally small in size, while sequential accesses tend to be larger and thus we have the four Iometer tests we use in all of our reviews.
Our first test writes 4KB in a completely random pattern over an 8GB space of the drive to simulate the sort of random access that you'd see on an OS drive (even this is more stressful than a normal desktop user would see). I perform three concurrent IOs and run the test for 3 minutes. The results reported are in average MB/s over the entire time. We use both standard pseudo randomly generated data for each write as well as fully random data to show you both the maximum and minimum performance offered by SandForce based drives in these tests. The average performance of SF drives will likely be somewhere in between the two values for each drive you see in the graphs. For an understanding of why this matters, read our original SandForce article.
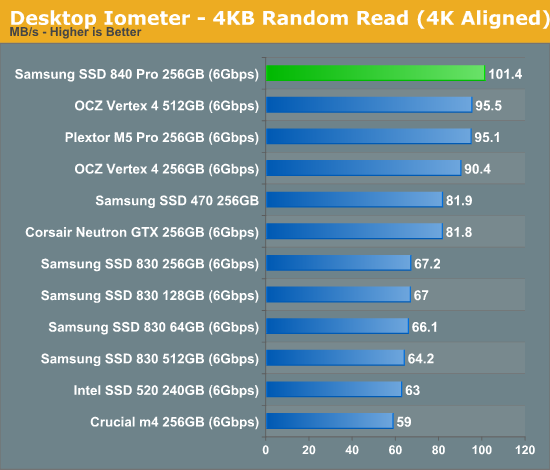
We have a new king, the 840 Pro manages to inch past the fastest Vertex 4 in our random read performance test.
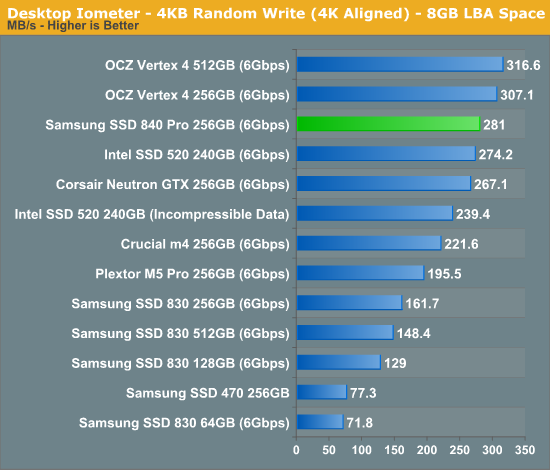
The low queue depth random write performance crown goes back to the Vertex 4, but the 840 Pro is around 75% faster than the old 830. Other than the Vertex 4, there's nothing faster than the 840 Pro here.
Many of you have asked for random write performance at higher queue depths. What I have below is our 4KB random write test performed at a queue depth of 32 instead of 3. While the vast majority of desktop usage models experience queue depths of 0 - 5, higher depths are possible in heavy I/O (and multi-user) workloads:
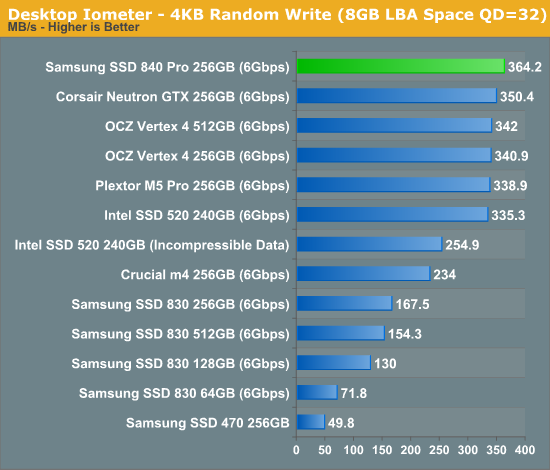
Ramp up queue depth and the 840 Pro manages to even outperform Corsair's new Neutron GTX.
Sequential Read/Write Speed
To measure sequential performance I ran a 1 minute long 128KB sequential test over the entire span of the drive at a queue depth of 1. The results reported are in average MB/s over the entire test length.
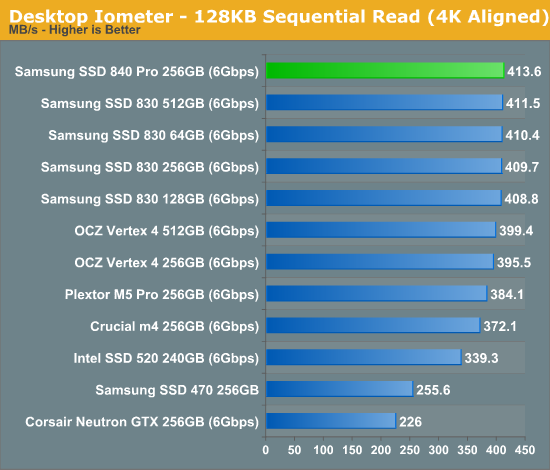
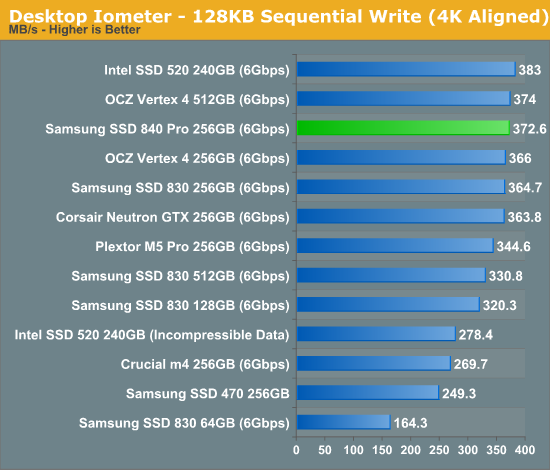
There are no tradeoffs here: excellent random IO performance and class leading low queue depth sequential performance. The 840 Pro is looking like a good all-around performer.
AS-SSD Incompressible Sequential Performance
The AS-SSD sequential benchmark uses incompressible data for all of its transfers. The result is a pretty big reduction in sequential write speed on SandForce based controllers.
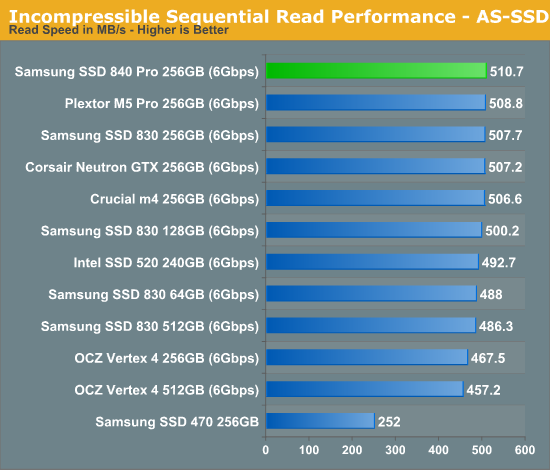
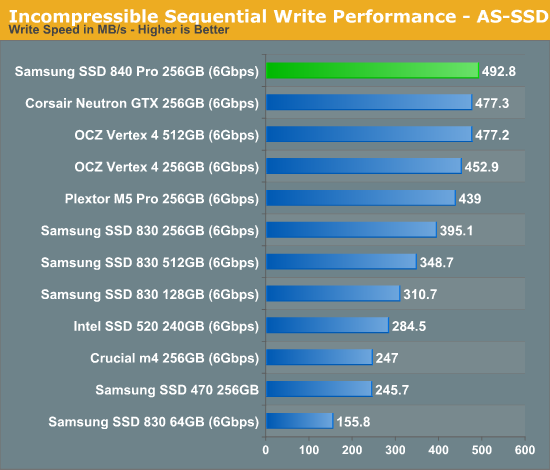
The 840 Pro lands on top once again in these higher queue depth sequential tests. The competition is hot on the heels of the 840 Pro however, we're limited by 6Gbps SATA here so expect continued clustering around 500MB/s going forward.


96 Comments
View All Comments
kensiko - Monday, September 24, 2012 - link
Interesting!Can Anand comment on that? Or verify it?
jb510 - Monday, September 24, 2012 - link
Same question. How do the Samsung provided numbers comparing the 830 to 840 on page 1:Active Power Use 0.24W 0.068W
Idle Power Use 0.14W 0.042W
Jive with the actual test numbers?
Guspaz - Monday, September 24, 2012 - link
I must be missing something, but on the first page, the rated power usage is:Active Power Use : 0.068W
Idle Power Use: 0.042W
While the actual measured use is 0.31W for idle and over 3W for active. That's about 50x higher, what's going on here?
btb - Monday, September 24, 2012 - link
Yeah, and no measurement of read power usage. Even though the typical user probably do an order of a magnitude more reads than writes. But thats a general anandtech testing problem, too much focus on the write specs instead of the more important read specs.ssj3gohan - Monday, September 24, 2012 - link
See my comment above here: Anandtech measures the power consumption wrongly. DIPM is not enabled, which causes ridiculously much higher power consumption.krumme - Monday, September 24, 2012 - link
The Anand hd bench was an excellent tool for comparisons, and one of the great tools Anand provided for us for delivering bm that reflected real world usage.What i derived from the first 2010 results was that the samsung disk was bad, but not so bad as it was portrayed by the reviewers and Anand. They were not worth their money, but they were slammed way to hard. At that time if we look at fx. strartup times, they were practically as fast as the fastest, so the criticism was ok, but a tad overblown.
At that time many producers was as Anand said, not focusing enough on random 4k, but i can say for sure, nothing but random 4k write was usable here at anandtech at that time too :)
sheh - Monday, September 24, 2012 - link
As usual, I'm curious about the data retention properties of drives, and how they change across a drive's lifespan as P/E cycles increase. It would be difficult to check directly, but perhaps the manufacturers can reveal the details? I also wonder if TLC will be disastrous in this regard.Kristian Vättö - Monday, September 24, 2012 - link
I asked about that in the Q&A session we had with Samsung engineers today but unsurprisingly, they couldn't tell us specific numbers. I hope to get my hands on 120GB 840 and 128GB 840 Pro to see what's the write endurance like, though that will take a while to test.FunBunny2 - Monday, September 24, 2012 - link
It looks like even the Pro has no standby cap? How can that be anything better than a toss away consumer drive?sheh - Monday, September 24, 2012 - link
They couldn't/wouldn't give numbers on P/E cycles or retention time?If you have a secret AnandTech stash of P/E exhausted drives (or could create one :), how about checksumming everything and testing every few months?