Original Link: https://www.anandtech.com/show/9763/the-amd-a8-7670k-apu-review-rocket-league
The AMD A8-7670K APU Review: Aiming for Rocket League
by Ian Cutress on November 18, 2015 8:00 AM EST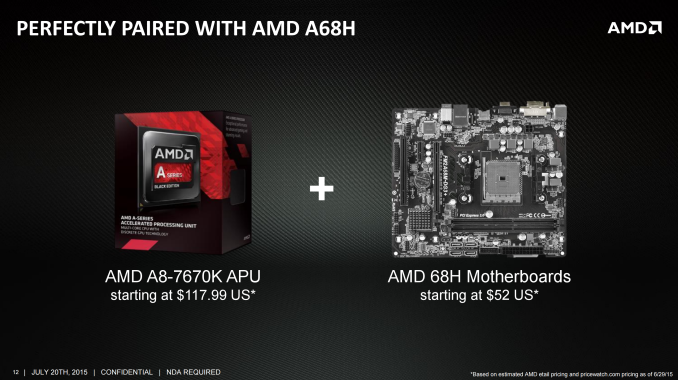
Over the past couple of years, AMD has slowly released their mainstream brand of Kaveri processors. In turn, we have reviewed them, and they consistently aim to provide a midrange integrated gaming option, especially for those on a budget. The recent release of the A8-7670K was perhaps not that exciting, as AMD is filling up their product stack with new parts, taking advantage of an improved manufacturing process and aggressive binning. To that end, we're taking a different tack with this review. Alongside the regular tests, we also corralled Rocket League (an amazingly simple yet popular take on car football/soccer that sits on the precipice of e-sports glory) into a benchmark aimed at those sub-$600 gaming systems.
The AMD A8-7670K
Earlier this year, AMD announced their new line of Kaveri Refresh processors, starting with the A10-7870K (which we reviewed here). As the name suggests, these are Kaveri processors at their core, still based on the combination of Steamroller processor cores and 2nd generation Graphics Core Next (GCN) microarchitecture for graphics. These new refresh models are designed to take advantage of minor improvements in manufacturing, resulting in the ability to get higher clock speed for the same power consumption, even 18 months after the first Kaveri processors hit the scene. As a result, these Refresh processors — or, to use AMD's internal code name, "Godavari" — fill in the blank spots in the product stack and supersede the older parts, with the aim of squeezing in more frequency and performance for the same power consumption. It sounds deceptively simple — improve your process, refresh the part at the same price, and reap the benefits.
If we look at AMD's current lineup, we see that this new A8-7670K surpasses the older A10-7700K on the specification sheet, and comes in cheaper when brand-new.
| AMD Kaveri Lineup | ||||||||
| A10- 7870K |
A10- 7850K |
A10- 7800 |
A10- 7700K |
A8- 7670K |
A8- 7650K |
A8- 7600 |
X4 860K |
|
| Price | $137 | $134 | $131 | $120 | $118 | $104 | $89 | $85 |
| Modules | 2 | 2 | 2 | 2 | 2 | 2 | 2 | 2 |
| Threads | 4 | 4 | 4 | 4 | 4 | 4 | 4 | 4 |
| Core Freq. (GHz) | 3.9-4.1 | 3.7-4.0 | 3.5-3.9 | 3.4-3.8 | 3.6-3.9 | 3.3-3.8 | 3.1-3.8 | 3.7-4.0 |
| Compute Units | 4+8 | 4+8 | 4+8 | 4+6 | 4+6 | 4+6 | 4+6 | 4+0 |
| Streaming Processors |
512 | 512 | 512 | 384 | 384 | 384 | 384 | N/A |
| IGP Freq. (MHz) | 866 | 720 | 720 | 720 | 754 | 720 | 720 | N/A |
| TDP | 95W | 95W | 65W | 95W | 95W | 95W | 65W | 95W |
| DRAM Frequency |
2133 | 2133 | 2133 | 2133 | 2133 | 2133 | 2133 | 1866 |
| L2 Cache | 2x2MB | 2x2MB | 2x2MB | 2x2MB | 2x2MB | 2x2MB | 2x2MB | 2x2MB |
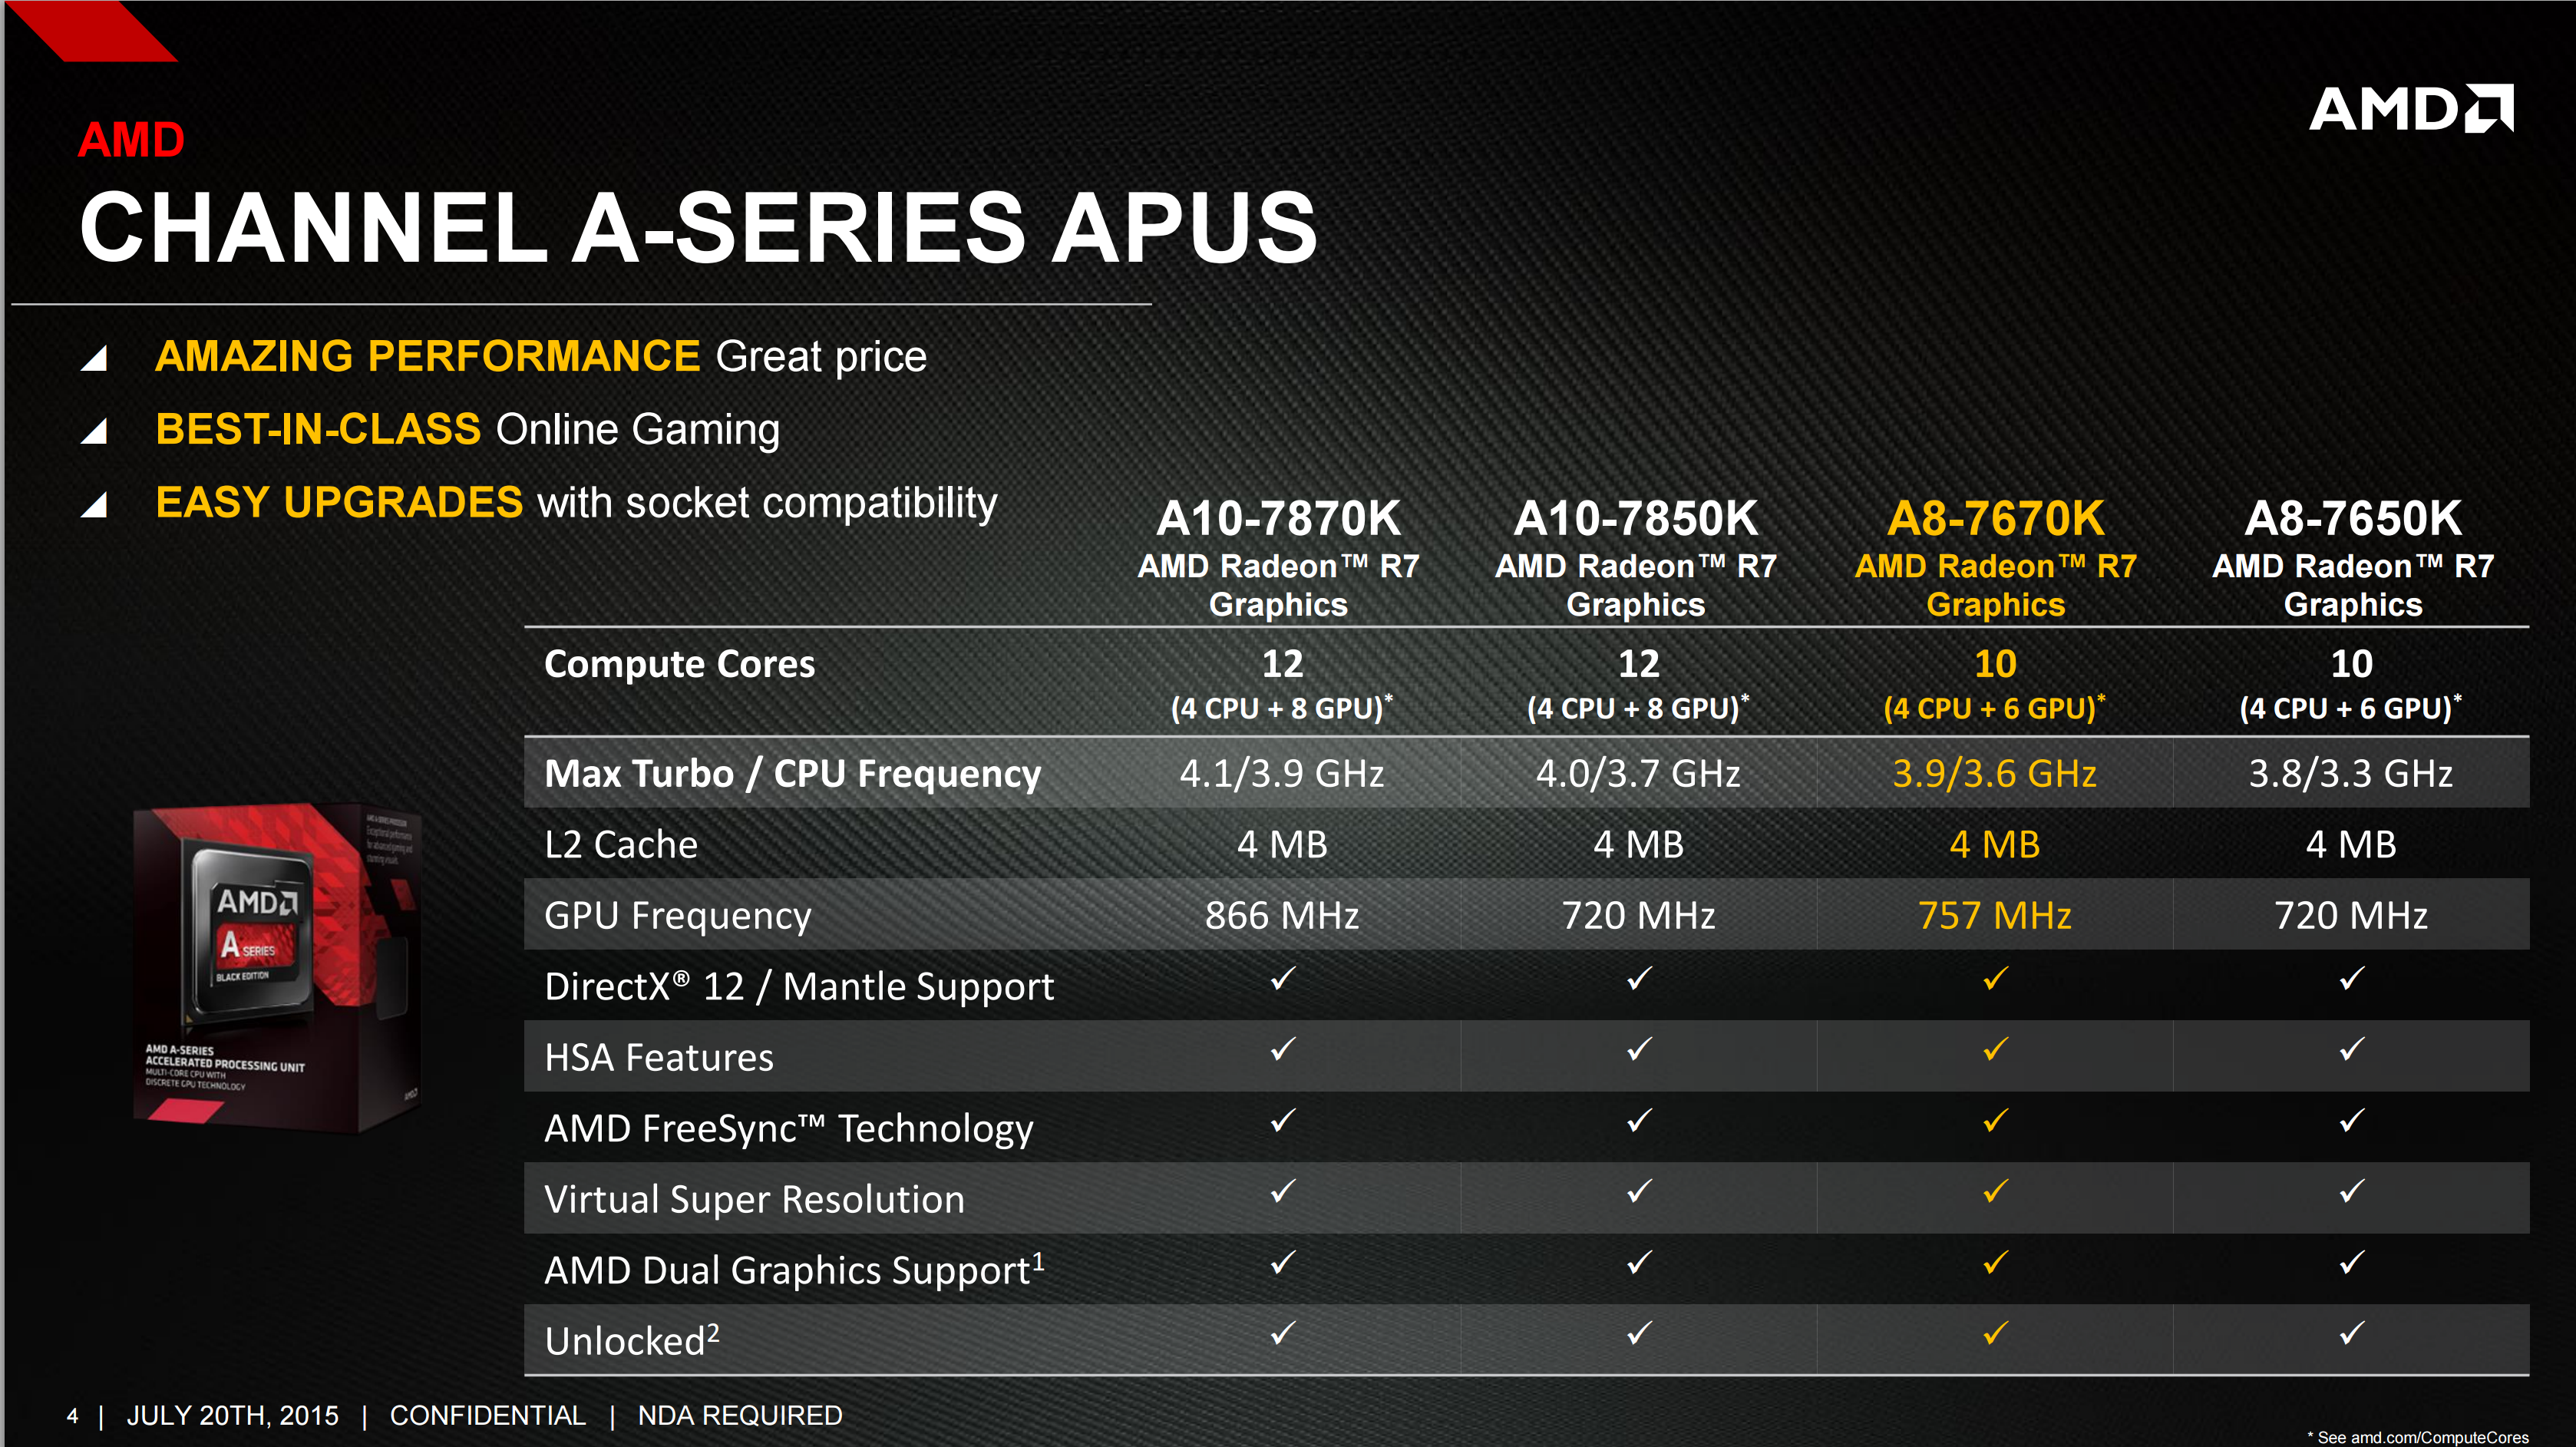
As it stands, the A8-7670K is a dual-module 3.6 GHz base frequency processor with a boost frequency up to 3.9 GHz. It comes with six graphics compute units, which translates to 384 streaming processors, similar to other A8 parts, but at a slightly higher IGP frequency of 754 MHz. The combined increase in processor and integrated graphics frequencies come at no extra cost in thermal design, with the A8-7670K at the same 95W TDP.

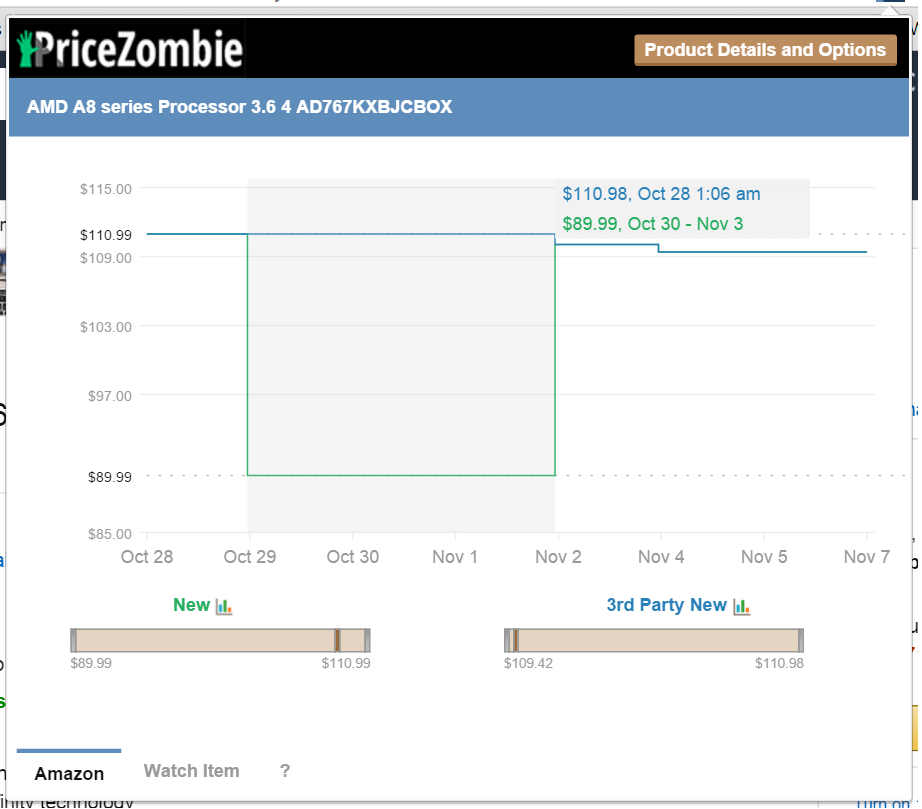
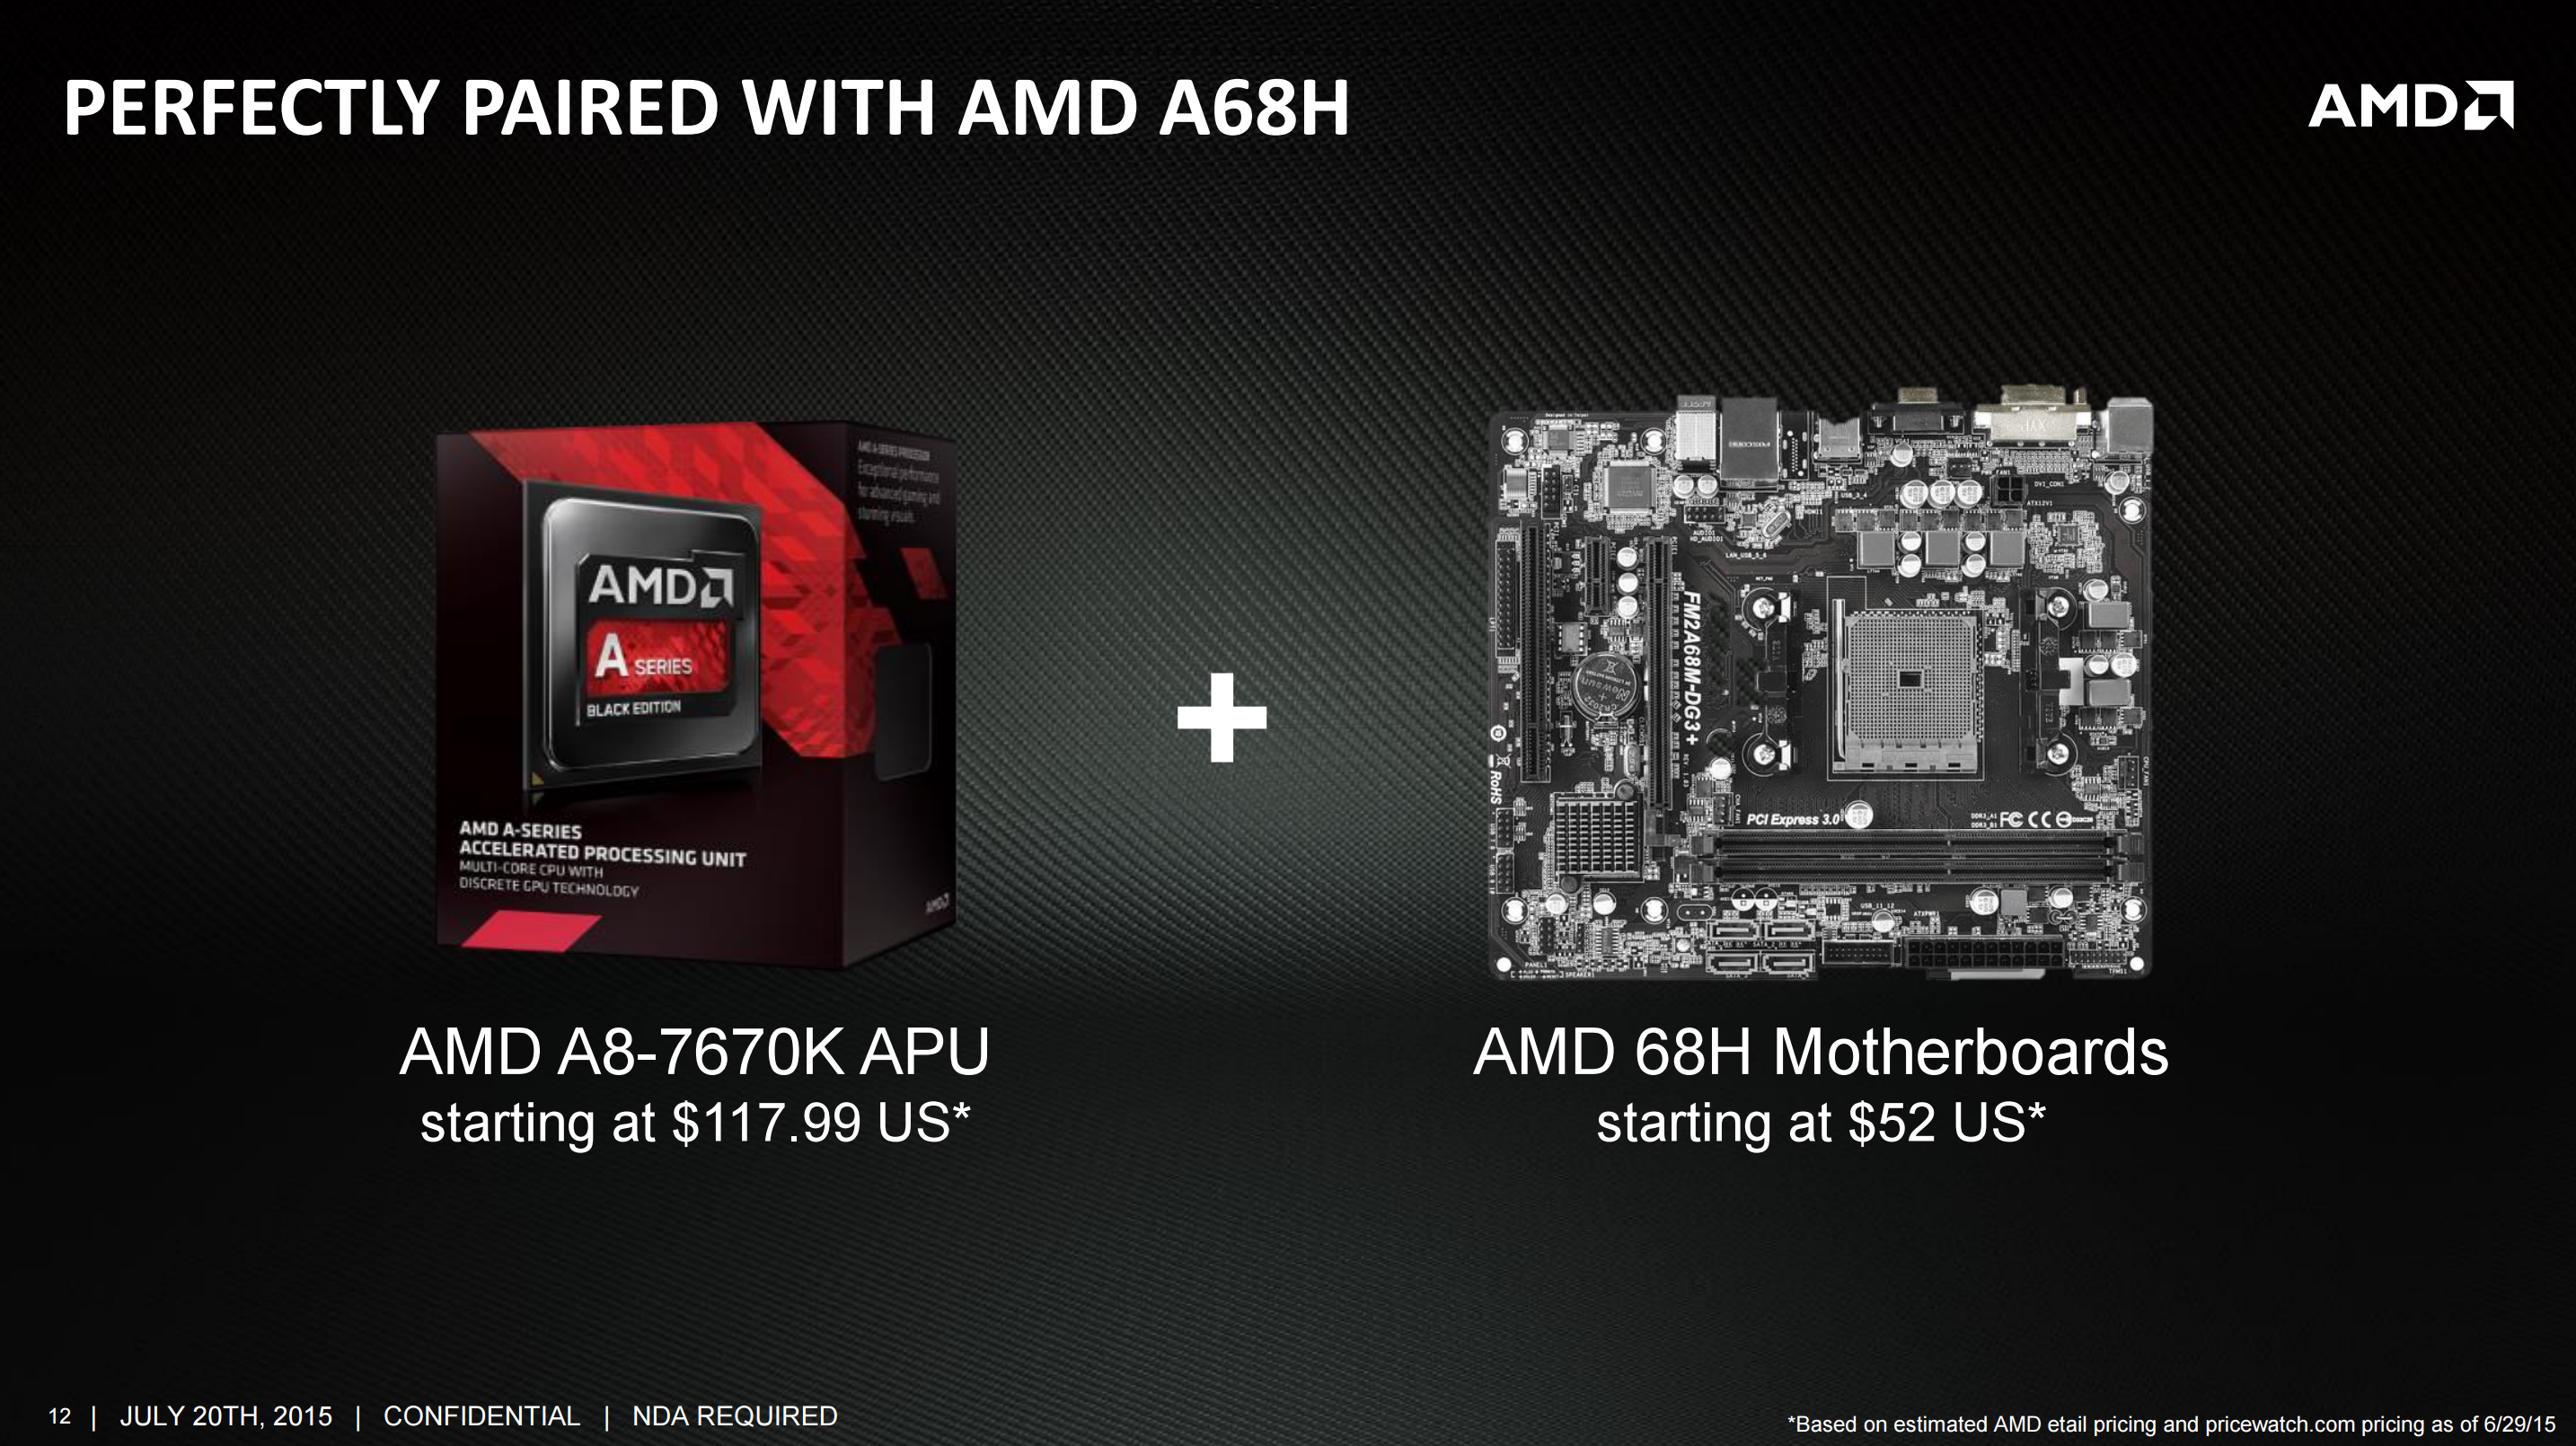
One of AMD's marketing strategies with these ~$100 processors is the price/performance angle. Aside from the integrated graphics, each of the AMD processors can pair with an R7 240 or R7 250 graphics card (DDR3 or GDDR5; AMD suggests an R7 250 GDDR5, as you might expect) in a hybrid dual graphics scenario, boosting performance. Thus, for the same price as an APU and an R7 250 graphics card, on average, AMD aims to offer a better gaming experience — especially for games that run at around 60 frames per second on medium settings — than a similarly priced Intel + NVIDIA platform. We've seen this marketing spiel corroborated in previous reviews, and would expect not to see anything different here. At launch, AMD put a $118 price on the A8-7670K, which, in recent sales, has been pushed down to under $100 at times.
The A8-7670K is an FM2+ socket processor, and thus requires either an A88X, A85X, A78 or A68 motherboard to go with it in order to take full advantage. As part of the launch, and given that this processor is a slightly boosted A8-7650K, AMD sees value in pairing it with something like a $50 A68H motherboard, making an APU+MB combination around $150 when on sale. However, as one might imagine, due to the age of the FM2/FM2+ socket, there are relatively few "new" motherboards on the market. The last one we reviewed was MSI's A88X-G45 Gaming, which brought over some of the components seen on its new Intel gaming motherboards, but other manufacturers have also put out M.2 capable AMD chipset-based motherboards as well.
The Testing
A number of factors about the A8-7670K processor suggest that this is "another release of the same sort of stuff," albeit with increased frequencies. Nevertheless, we put the processor through our regular tests, to see what would happen. Our bench suite this time had one omission and one addition. For whatever reason, Linux Bench refused to run, with Ubuntu 14.04 throwing a hissy fit and not willing to start. I’m not sure if this was a BIOS issue or something more fundamental with the software stack, but it was odd. The addition, as the title of the review alluded to, is a Rocket League benchmark. At this time, we haven’t run it on many systems, but the A8-7670K is the sort of APU that enables games like Rocket League. Rocket League is a good contender for our 2016 CPU/APU benchmark suite on the integrated graphics side of things, and this serves as a good tester in the wild.
All of our regular benchmark results can also be found in our benchmark engine, Bench. Rocket League will be added in the future with the 2016 updates.
Test Setup
| Test Setup | |
| Processor | AMD A8-7670K 2 Modules, 4 Threads 3.6 GHz (3.9 GHz Turbo) R7 Integrated Graphics 384 SPs at 756 MHz |
| Motherboards | MSI A88X-G45 Gaming |
| Cooling | Cooler Master Nepton 140XL |
| Power Supply | OCZ 1250W Gold ZX Series Corsair AX1200i Platinum PSU |
| Memory | G.Skill 2x8 GB DDR3-2133 1.5V |
| Memory Settings | JEDEC |
| Video Cards | ASUS GTX 980 Strix 4GB MSI GTX 770 Lightning 2GB (1150/1202 Boost) ASUS R7 240 2GB |
| Hard Drive | Crucial MX200 1TB |
| Optical Drive | LG GH22NS50 |
| Case | Open Test Bed |
| Operating System | Windows 7 64-bit SP1 |
Many thanks to...
We must thank the following companies for kindly providing hardware for our test bed:
Thank you to AMD for providing us with the R9 290X 4GB GPUs.
Thank you to ASUS for providing us with GTX 980 Strix GPUs and the R7 240 DDR3 GPU.
Thank you to ASRock and ASUS for providing us with some IO testing kit.
Thank you to Cooler Master for providing us with Nepton 140XL CLCs.
Thank you to Corsair for providing us with an AX1200i PSU.
Thank you to Crucial for providing us with MX200 SSDs.
Thank you to G.Skill and Corsair for providing us with memory.
Thank you to MSI for providing us with the GTX 770 Lightning GPUs.
Thank you to OCZ for providing us with PSUs.
Thank you to Rosewill for providing us with PSUs and RK-9100 keyboards.
Load Delta Power Consumption
Power consumption was tested on the system while in a single GTX 770 configuration with a wall meter connected to the OCZ 1250W power supply. This power supply is Gold rated, and as I am in the U.K. on a 230-240 V supply, that leads to ~75% efficiency at greater than 50W, and 90%+ efficiency at 250W, suitable for both idle and multi-GPU loading. This method of power reading allows us to compare the power management of the UEFI and the board to supply components with power under load, and includes typical PSU losses due to efficiency.
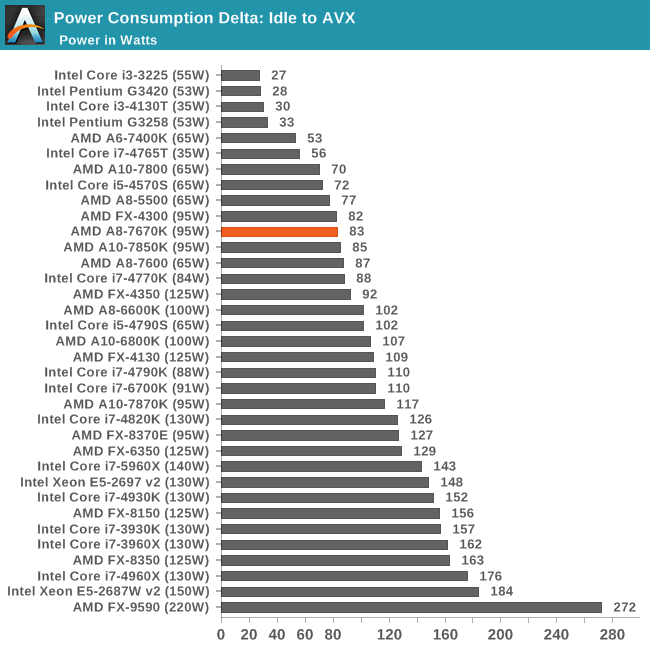
The TDP for the A8-7670K is up at 95W, similar to many other AMD processors. However, at load, ours drew only an additional 83W, giving some headroom.
AMD A8-7670K Overclocking
For this review, we even tried our hand at overclocking on the MSI A88X-G45 Gaming motherboard and managed to get 4.6 GHz stable.
Methodology
Our standard overclocking methodology is as follows. We select the automatic overclock options and test for stability with POV-Ray and OCCT to simulate high-end workloads. These stability tests aim to catch any immediate causes for memory or CPU errors.
For manual overclocks, based on the information gathered from previous testing, we start off at a nominal voltage and CPU multiplier, and the multiplier is increased until the stability tests are failed. The CPU voltage is increased gradually until the stability tests are passed, and the process is repeated until the motherboard reduces the multiplier automatically (due to safety protocol) or the CPU temperature reaches a stupidly high level (100º C+, or 212º F). Our test bed is not in a case, which should push overclocks higher with fresher (cooler) air.
Overclock Results

MSI’s motherboard doesn’t allow fixed voltages to be set but prefers to rely on an offset system only. There is a problem here that we are also fighting a DVFS implementation, which will automatically raise the voltage when an overclock is applied, with an end result of stacking the overclock voltage offset on top of the DVFS voltage boost. On our cooling system, the processor passed quite easily up to 4.6 GHz without much issue, but 4.7 GHz produced an instant blue screen when a rendering workload was applied. Hitting 4.6 GHz on a midrange AMD processor is quite good, indicating our sample is some nice silicon, but your mileage might vary.
Office Performance
The dynamics of CPU Turbo modes, both Intel and AMD, can cause concern in environments with variably-threaded workloads. There is also an added issue of the motherboard remaining consistent, depending on how the motherboard manufacturer wants to add in their own boosting technologies over the ones that Intel would prefer they used. In order to remain consistent, we implement an OS-level unique high-performance mode on all the CPUs we test, which should override any motherboard manufacturer performance mode.
All of our benchmark results can also be found in our benchmark engine, Bench.
Dolphin Benchmark: link
Many emulators are often bound by single-thread CPU performance, and general reports tended to suggest that Haswell provided a significant boost to emulator performance. This benchmark runs a Wii program that ray traces a complex 3D scene inside the Dolphin Wii emulator. Performance on this benchmark is a good proxy of the speed of Dolphin CPU emulation, which is an intensive single-core task using most aspects of a CPU. Results are given in minutes, where the Wii itself scores 17.53 minutes.
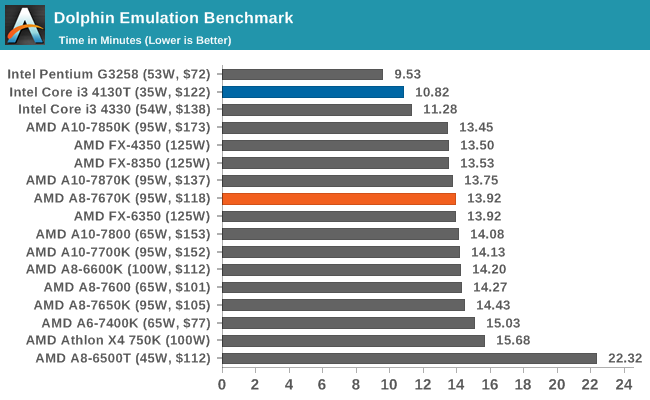
All AMD CPUs performed similarly here.
WinRAR 5.0.1: link
Our WinRAR test from 2013 is updated to the latest version of WinRAR at the start of 2014. We compress a set of 2,867 files across 320 folders totaling 1.52GB – 95% of these files are small typical website files, and the rest (90% of the size) are small 30-second 720p videos.
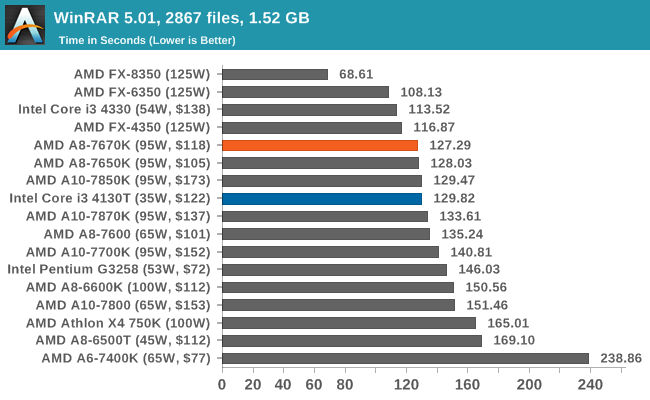
WinRAR is all about threads and DRAM speed, so the CPUs that can support higher DRAM frequencies get a boost.
3D Particle Movement
3DPM is a self-penned benchmark, taking basic 3D movement algorithms used in Brownian motion simulations and testing them for speed. High floating point performance, MHz and IPC win in the single-thread version, whereas the multithread version has to handle the threads, and loves more cores.
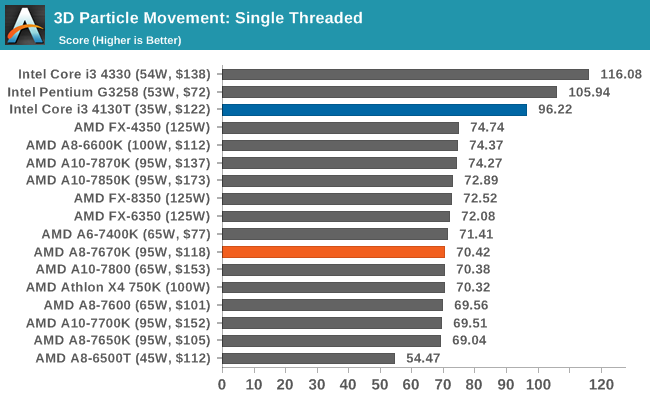
Again, all AMD CPUs seem to perform similarly in 3DPM for single-thread mode, indicating that something more fundamental about the design is a bottleneck.
FastStone Image Viewer 4.9
FastStone is the program I use to perform quick or bulk actions on images, such as resizing, adjusting for color and cropping. In our test, we take a series of 170 images in various sizes and formats, and convert them all into 640x480 .gif files, maintaining the aspect ratio. FastStone does not use multithreading for this test, and results are given in seconds.
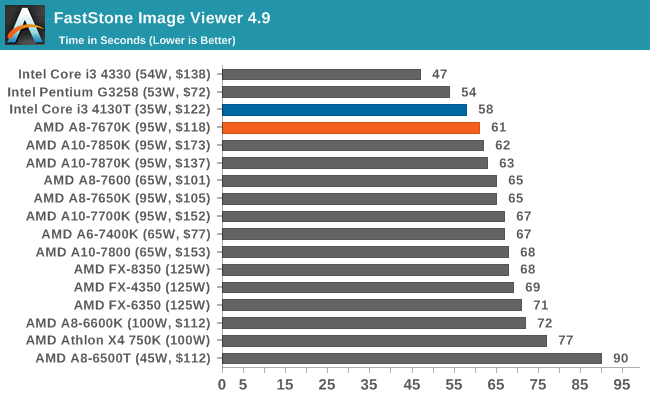
Single-thread frequency and IPC win here.
Web Benchmarks
On the lower-end processors, general usability is a big factor of experience, especially as we move into the HTML5 era of Web browsing. For our Web benchmarks, we take four well-known tests with Chrome 35 as a consistent browser.
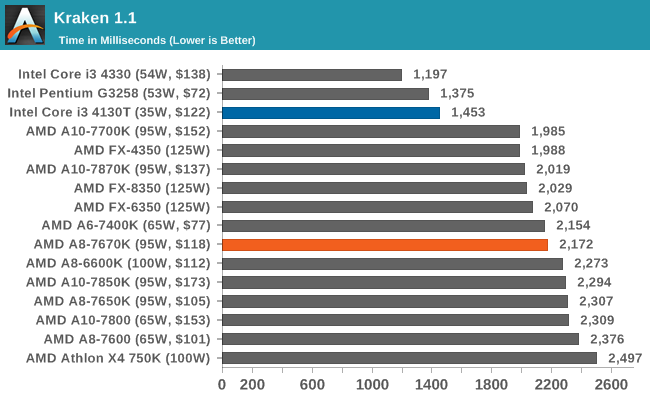
Mozilla Kraken 1.1
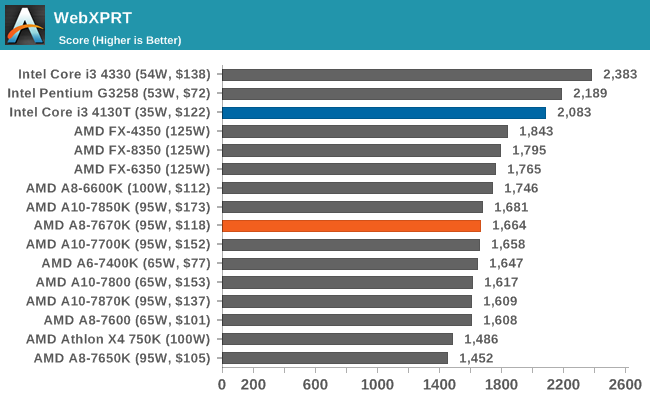
WebXPRT
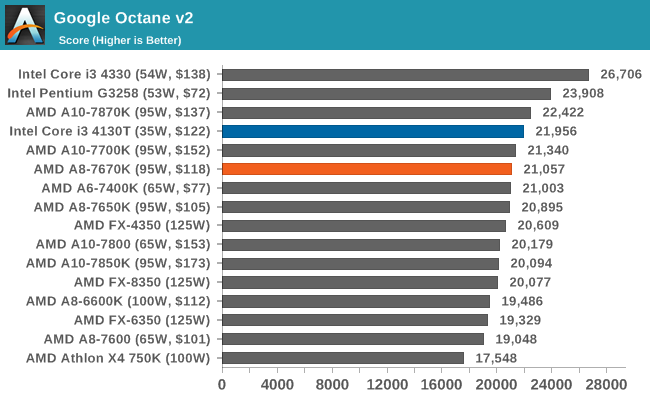
Google Octane v2
Professional Performance: Windows
Agisoft PhotoScan – 2D to 3D Image Manipulation: link
Agisoft PhotoScan creates 3D models from 2D images — a process that is very computationally expensive. The algorithm is split into four distinct phases, and different phases of the model reconstruction require either fast memory, fast IPC, more cores, or even OpenCL compute devices to achieve the best performance. Agisoft supplied us with a special version of the software to script the process, where we take 50 images of a stately home and convert it into a medium-quality model. This benchmark typically takes around 15 to 20 minutes on a high-end PC on the CPU alone, with GPUs reducing the time.
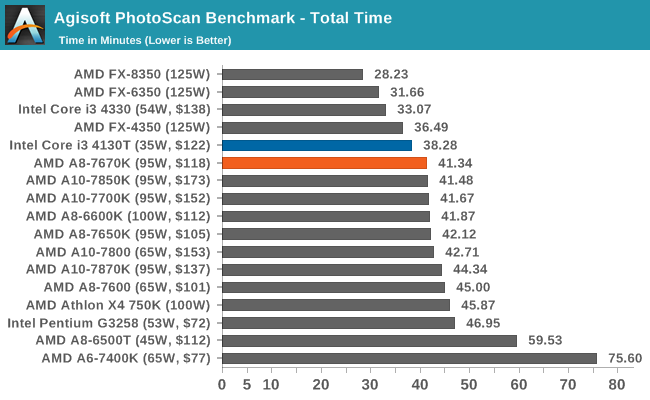
PhotoScan shows most APUs performing around 41 to 42 minutes, which suggests that there is a bottleneck in the core design.
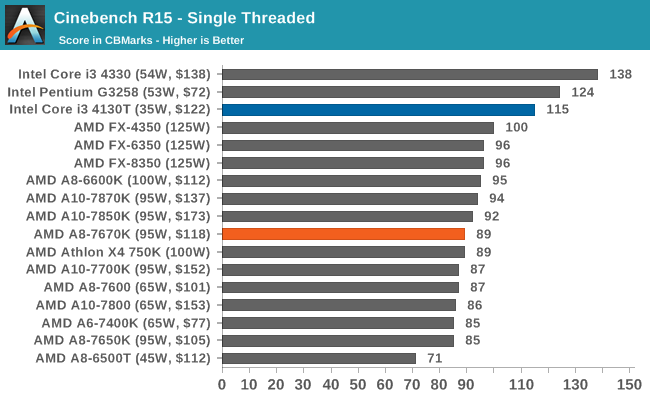
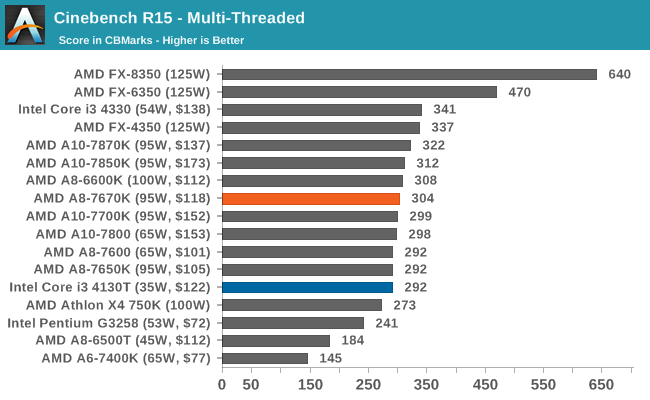
Cinebench R15
Cinebench is a benchmark based around Cinema 4D, and is fairly well known among enthusiasts for stressing the CPU for a provided workload. Results are given as a score, where higher is better.
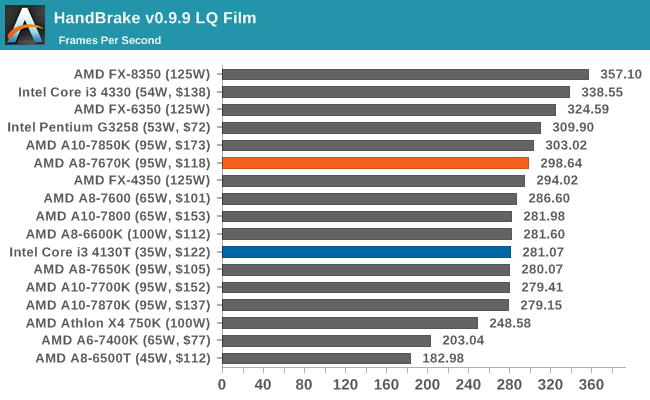
HandBrake v0.9.9: link
For HandBrake, we take a video (a 2h20 640x266 DVD rip) and convert it to x264 format in an MP4 container. Results are given in terms of the frames per second processed, and HandBrake uses as many threads as possible.
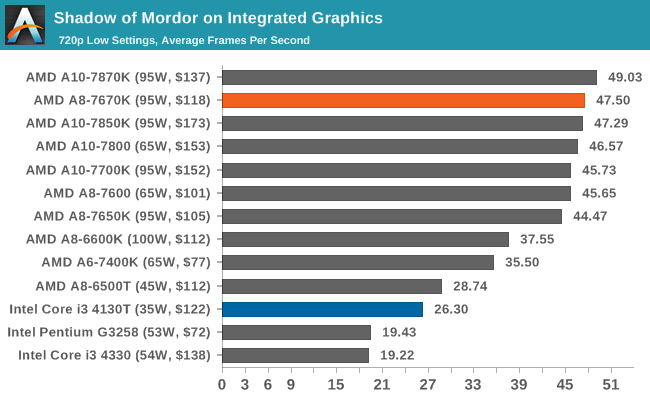
Gaming Benchmarks: Low End
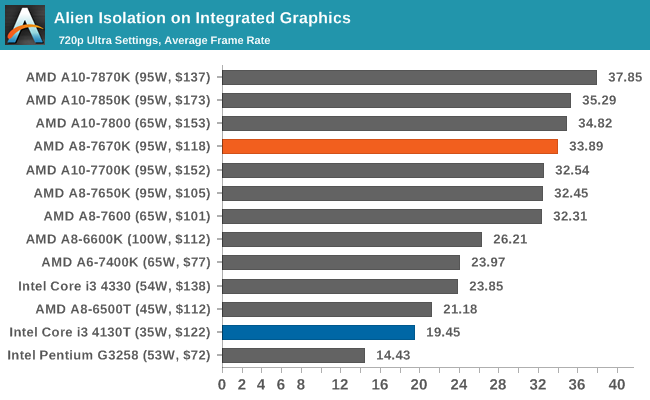
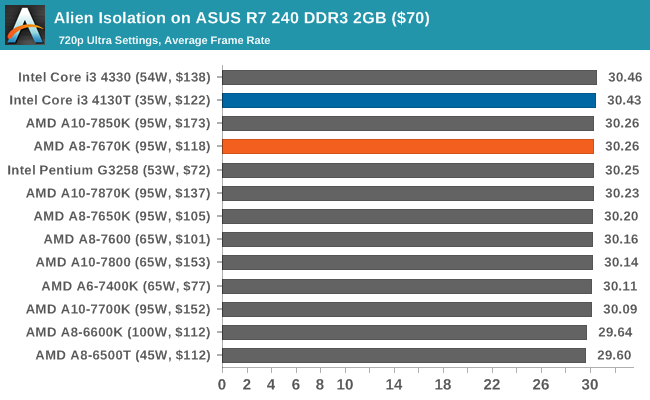
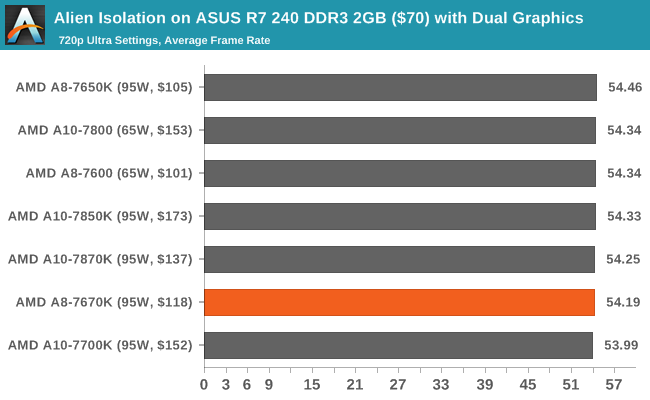
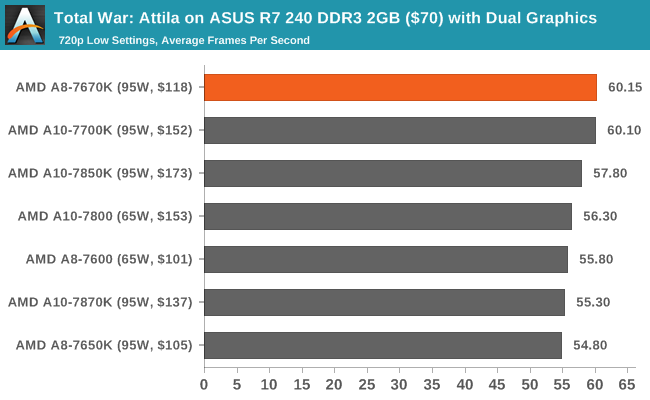
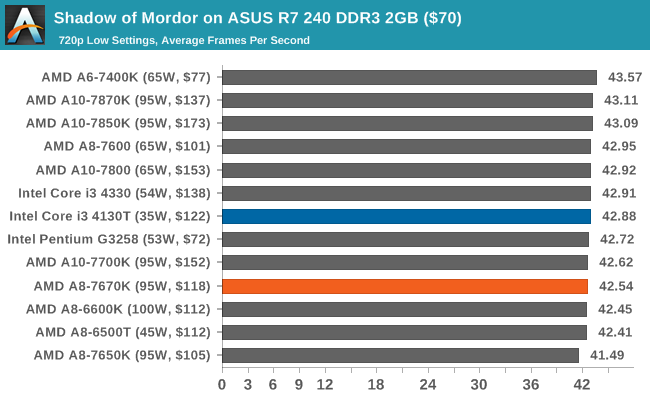
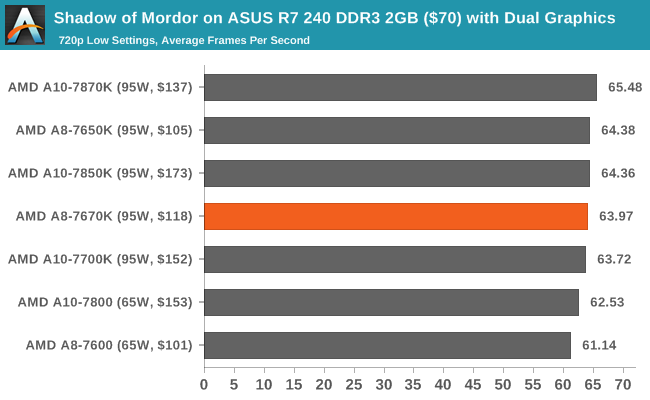
To satisfy our curiosity regarding low-power gaming, as well as dual graphics arrangements, we ran our regular suite through each processor. On this page are our integrated graphics results, along with a cheaper graphics solution in the R7 240 DDR3 and, in the case of AMD, both of these together in dual graphics mode.
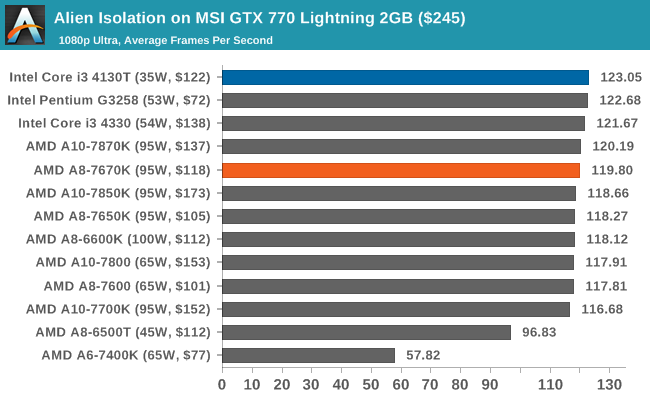
Alien: Isolation
If first-person survival mixed with horror is your sort of thing, then Alien: Isolation, based off of the Alien franchise, should be an interesting title. Developed by Creative Assembly and released in October 2014, Alien: Isolation has won numerous awards, ranging from Game Of The Year to several top 10s/25s and Best Horror titles, ratcheting up over a million sales by February 2015. Alien: Isolation uses a custom-built engine that includes dynamic sound effects and should be fully multicore enabled.
For low-end graphics, we test at 720p with Ultra settings, whereas for mid- and high-range graphics, we bump this up to 1080p, taking the average frame rate as our marker with a scripted version of the built-in benchmark.
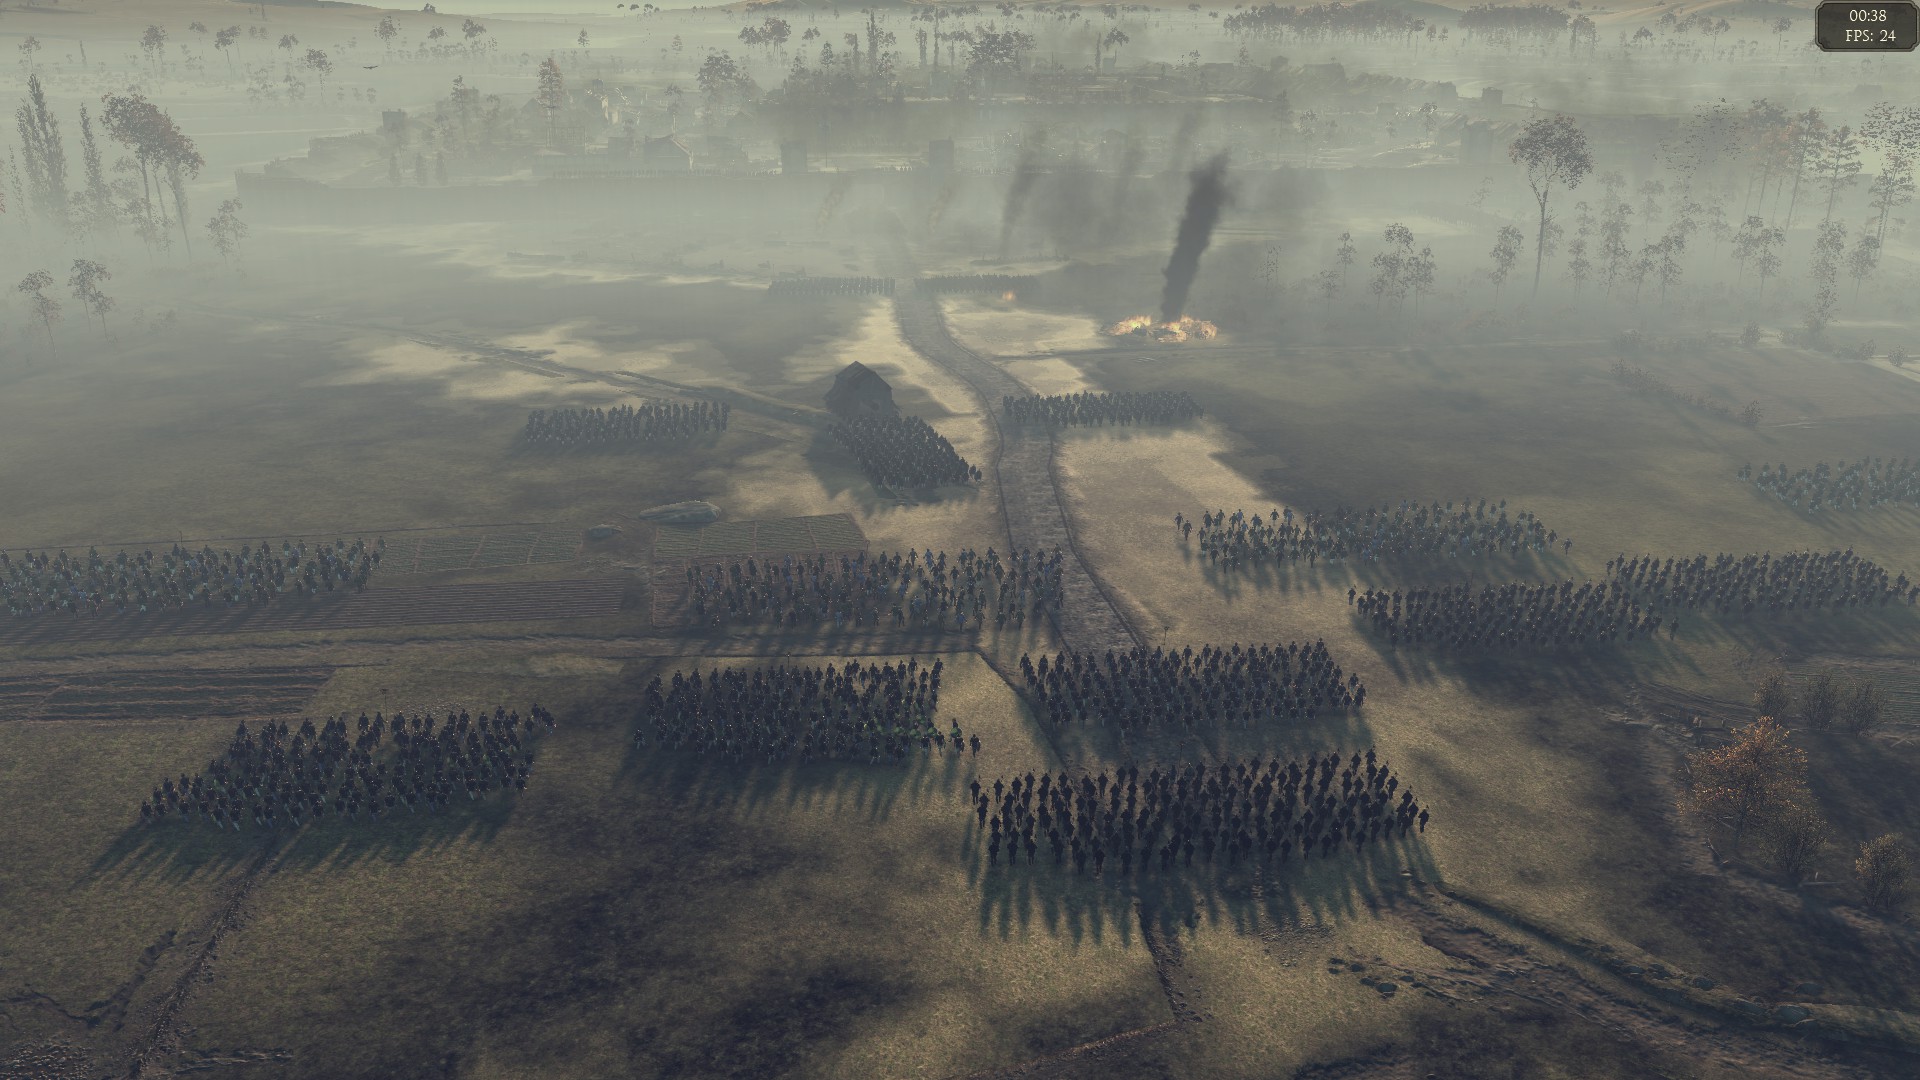
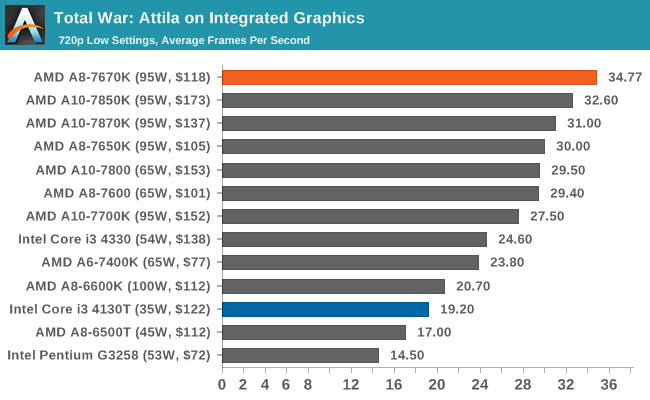
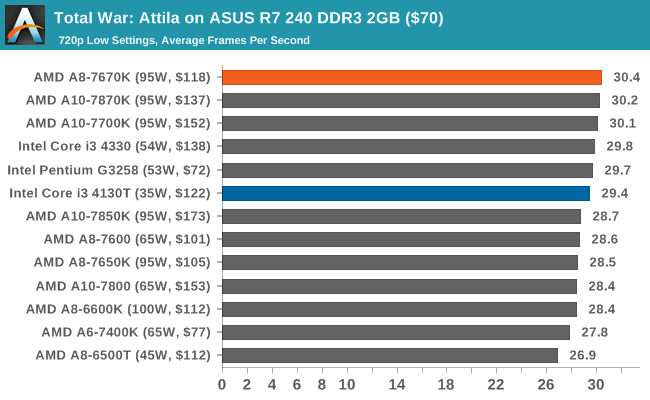
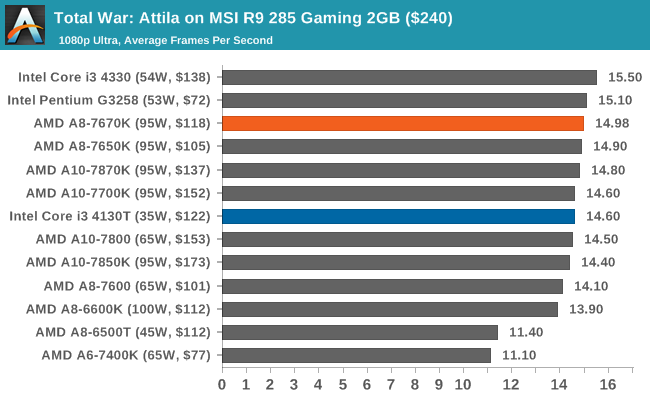
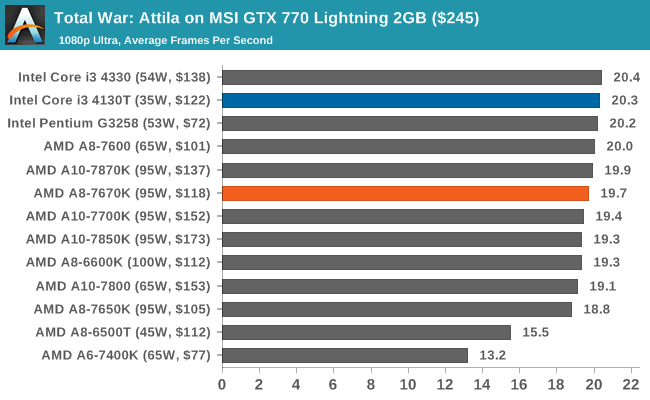
Total War: Attila
The Total War franchise moves on to Attila, another Creative Assembly development, and is a stand-alone strategy title set in 395AD where the main story line lets the gamer take control of the leader of the Huns in order to conquer parts of the world. Graphically, the game can render hundreds/thousands of units on-screen at once, all with their individual actions, and can put some of the big cards to task.
For low-end graphics, we test at 720p with performance settings, recording the average frame rate. With mid- and high-range graphics, we test at 1080p with the quality setting. In both circumstances, unlimited video memory is enabled, and the in-game scripted benchmark is used.
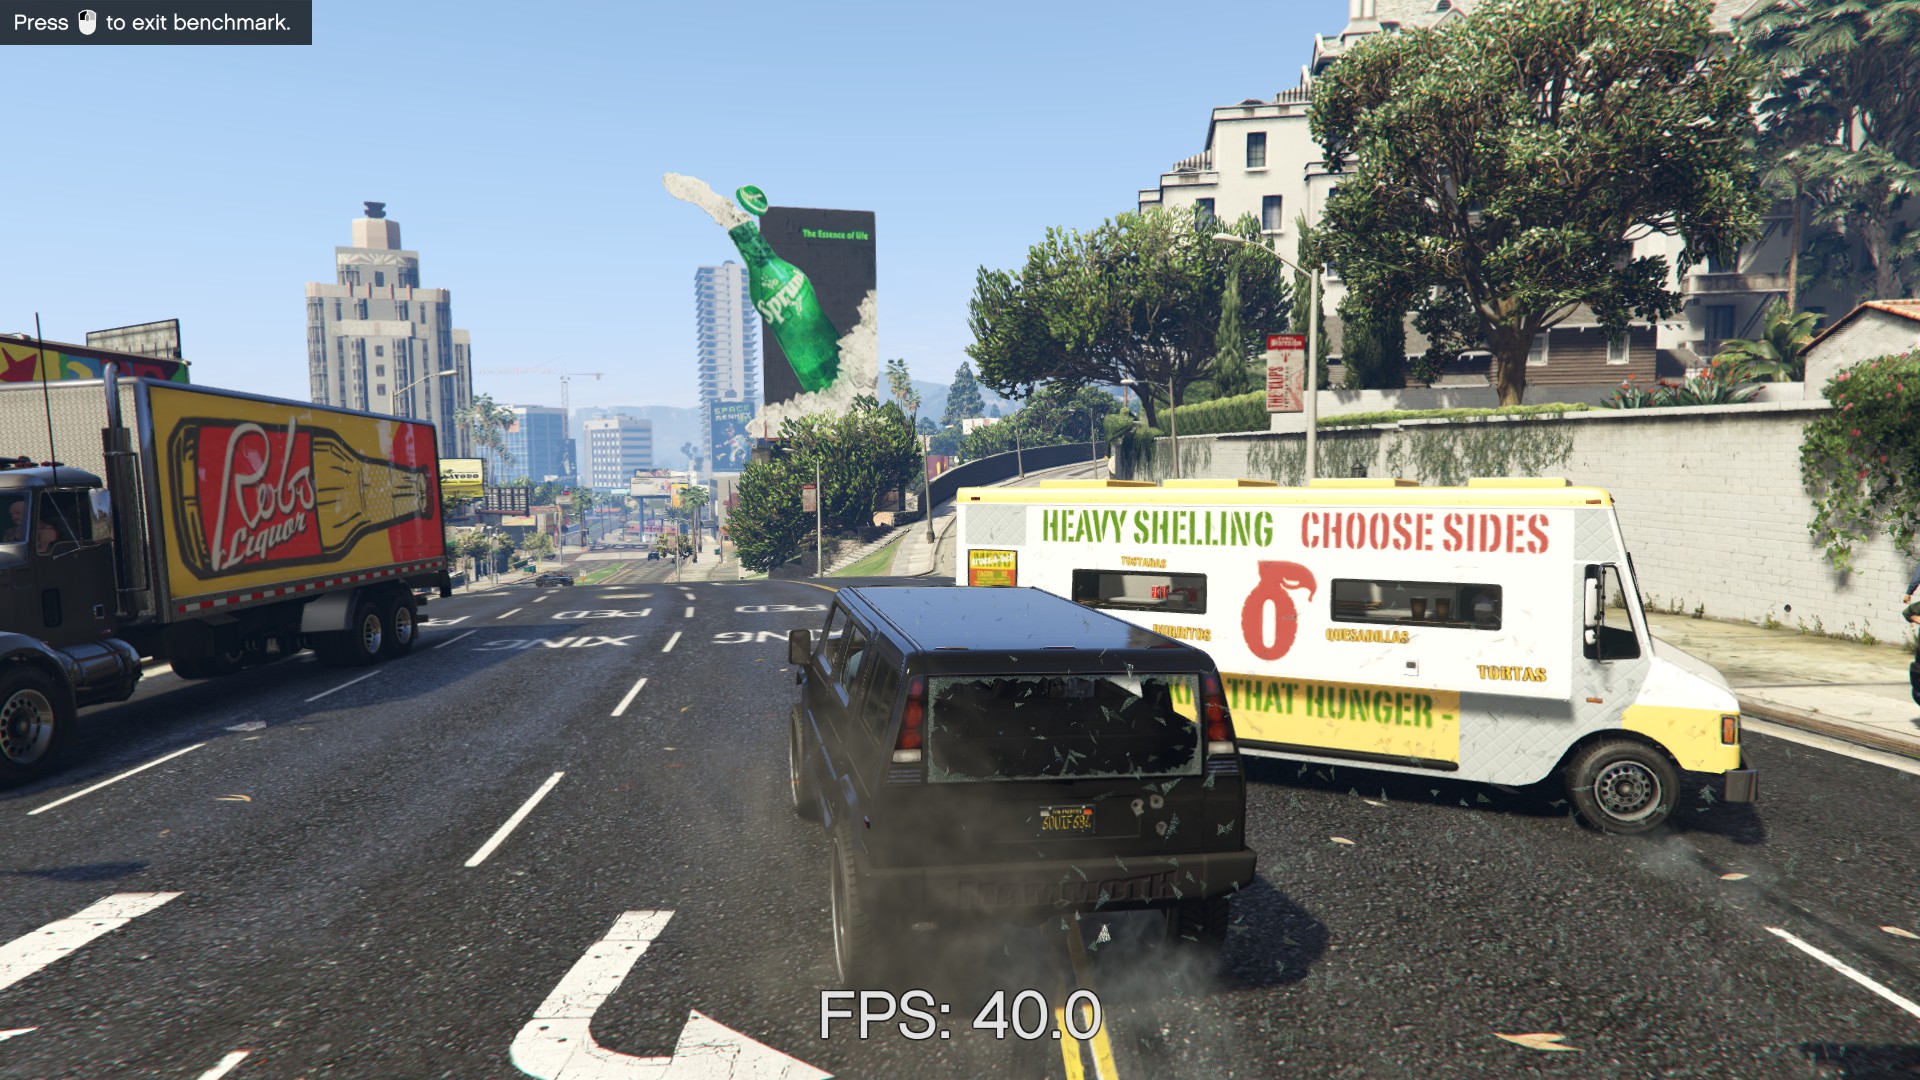
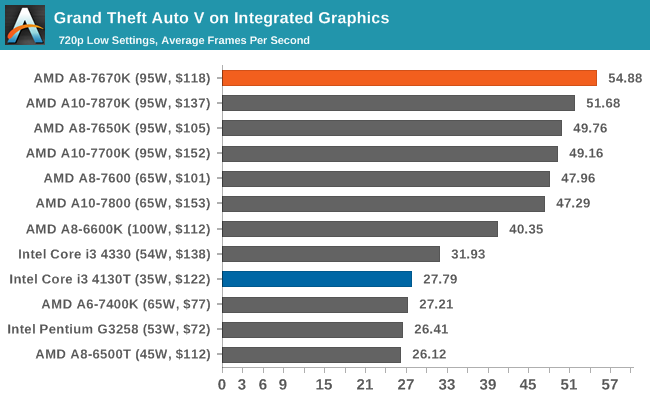
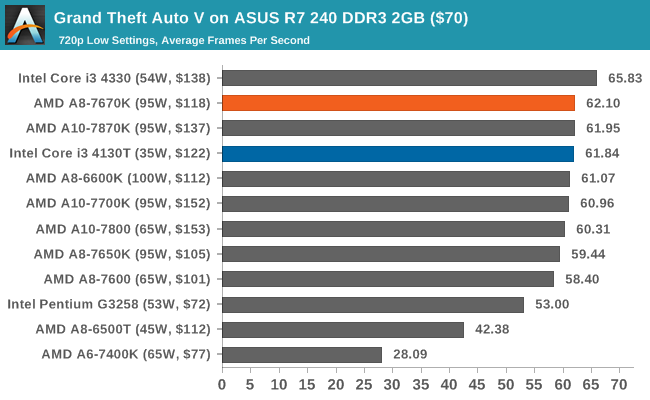
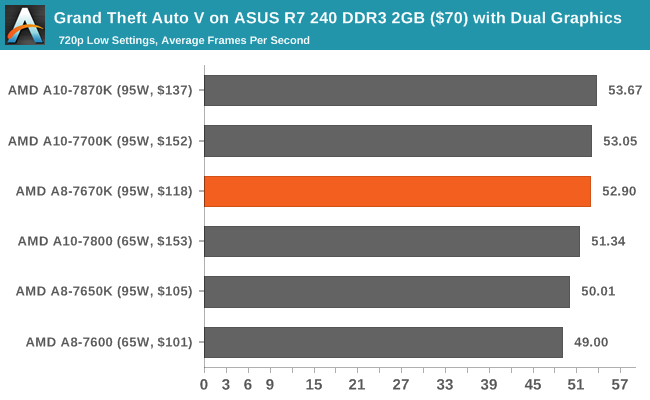
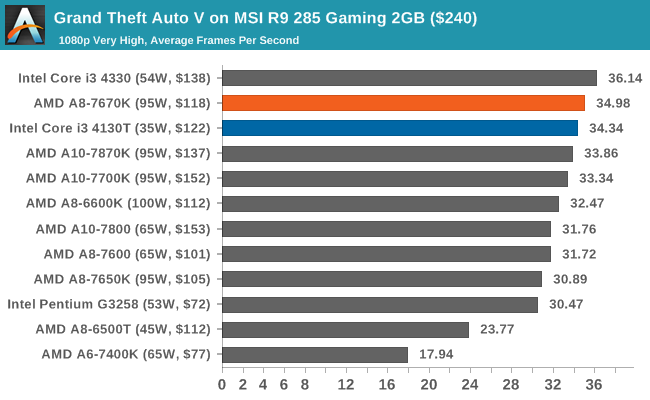
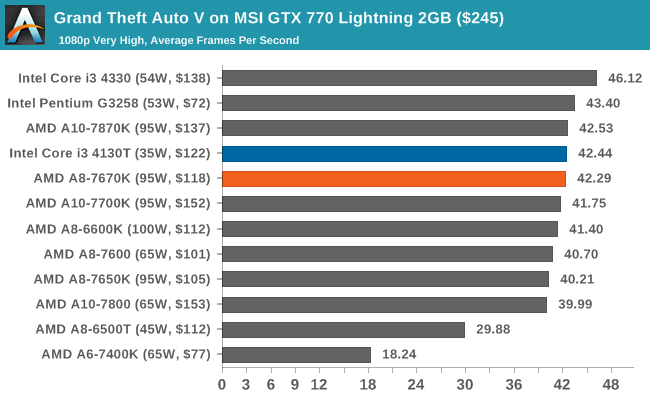
Grand Theft Auto V
The highly anticipated iteration of the Grand Theft Auto franchise finally hit the shelves on April 14, 2015, with both AMD and NVIDIA in tow to help optimize the title. GTA doesn’t provide graphical presets, but it opens up the options to users and extends the boundaries by pushing even the hardest systems to the limit using Rockstar’s Advanced Game Engine. Whether the user is flying high in the mountains with long draw distances or dealing with assorted trash in the city, when cranked up to maximum, it creates stunning visuals but hard work for both the CPU and the GPU.
For our test, we have scripted a version of the in-game benchmark, relying only on the final part, which combines a flight scene with an in-city drive-by, followed by a tanker explosion. For low-end systems, we test at 720p on the lowest settings, whereas mid- and high-end graphics play at 1080p with very high settings across the board. We record both the average frame rate and the percentage of frames under 60 fps (16.6 ms).
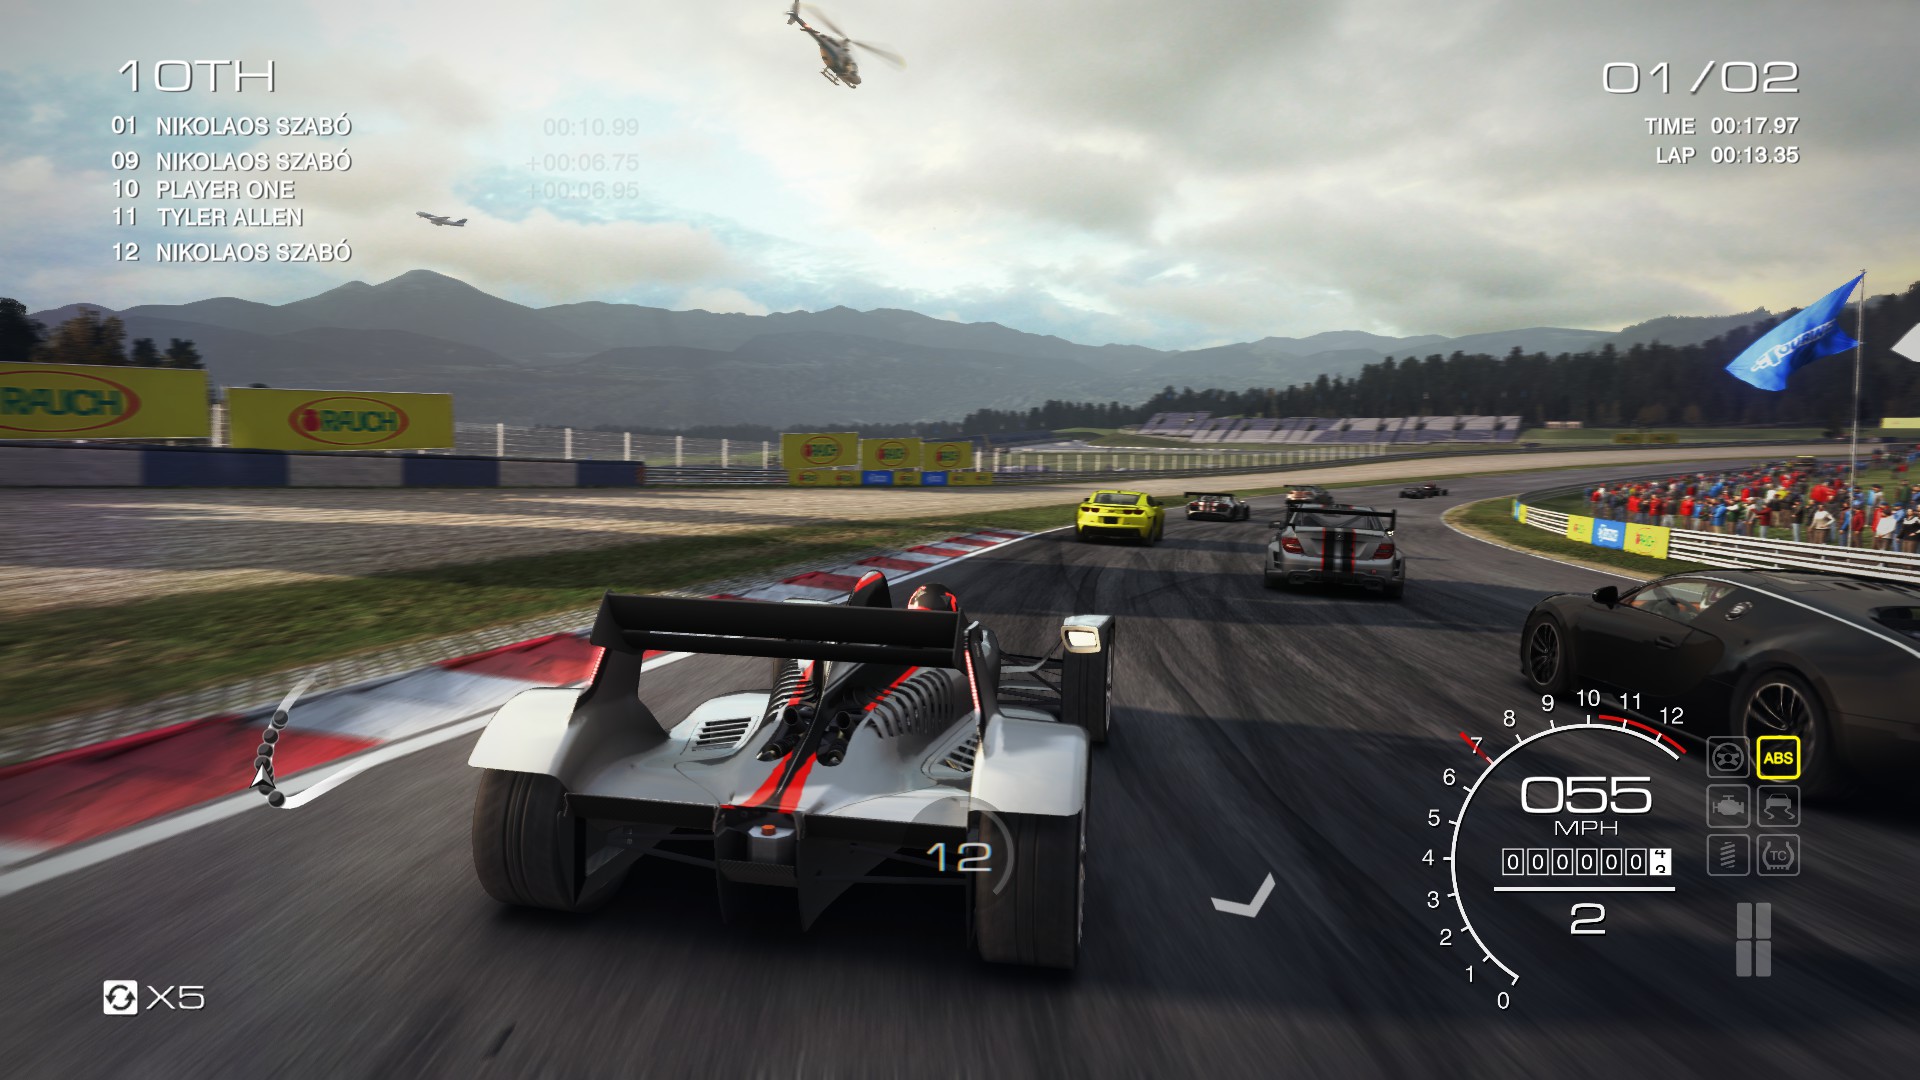
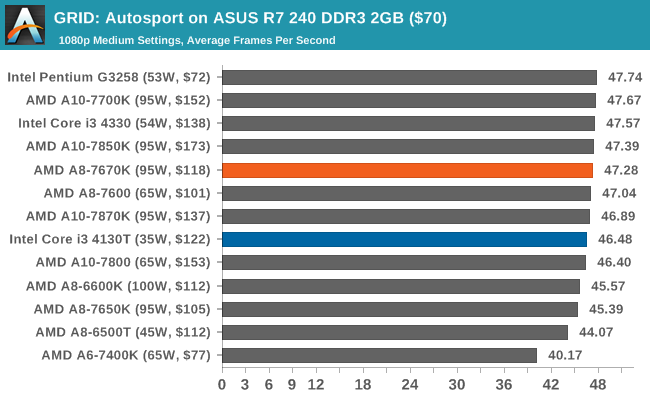
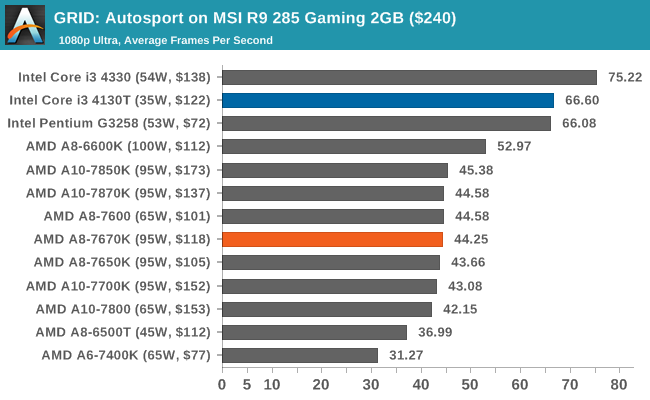
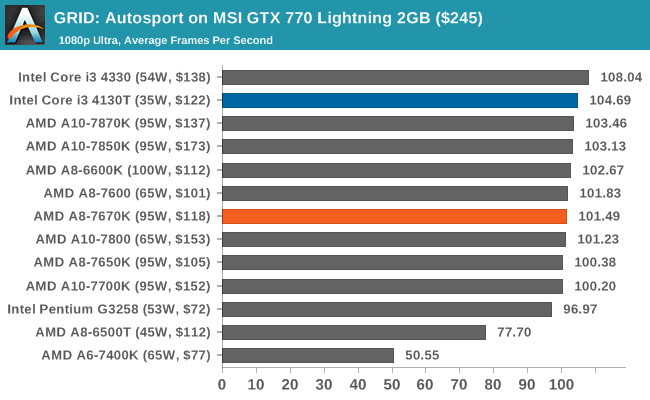
GRID: Autosport
No graphics test is complete without some input from Codemasters and the Ego engine, which means for this round of testing, we point toward GRID: Autosport, the next iteration in the GRID and racing genre. As with our previous racing testing, each update to the engine aims to add in effects, reflections, detail and realism, with Codemasters making "authenticity" a main focal point for this version.
GRID’s benchmark mode is very flexible, and as a result, we created a test race using a shortened version of the Red Bull Ring with 12 cars doing two laps. The player car is in focus throughout this benchmark and starts last, but usually finishes second or third. For low-end graphics, we test at 1080p and medium settings, whereas mid- and high-end graphics get the full 1080p maximum. Both the average and the minimum frame rates are recorded.
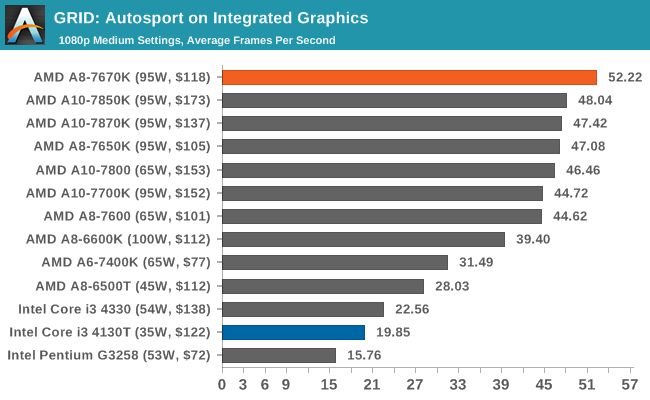
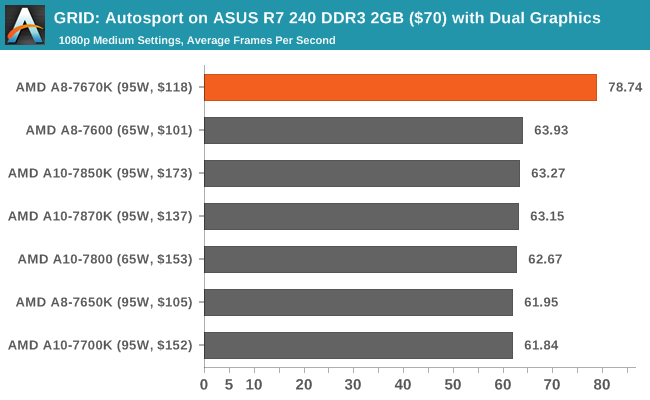
For whatever reason, the A8-7670K gets a good showing in the integrated tests, especially in dual graphics mode, with an abnormally high score. Some other issue might be at play here and warrants further testing.
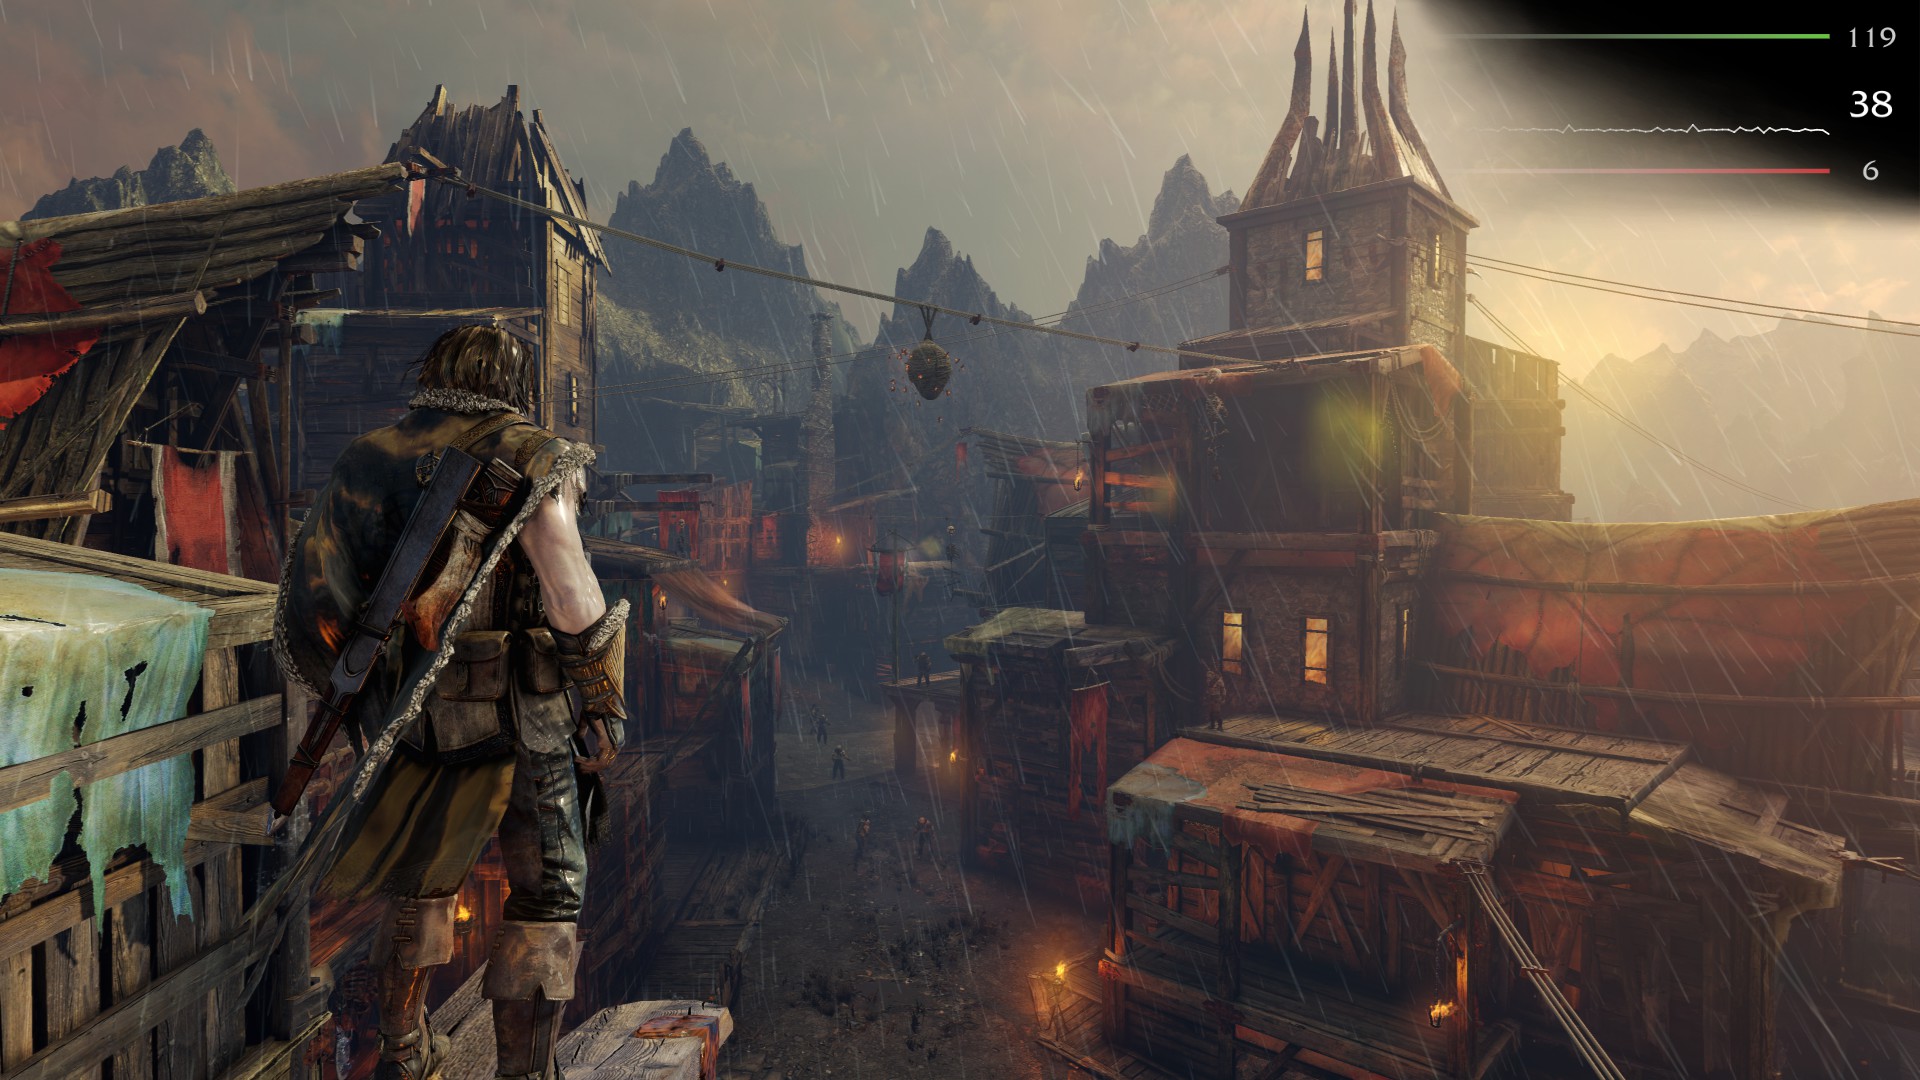
Middle-Earth: Shadows of Mordor
The final title in our testing is another battle of system performance with the open-world action-adventure title Shadow of Mordor. Produced by Monolith using the LithTech Jupiter EX engine and numerous detail add-ons, SoM goes for detail and complexity to a large extent, despite having to be cut down from the original plans. The main story was written by the same writer as Red Dead Redemption, and it received Zero Punctuation’s Game of The Year in 2014.
For testing purposes, SoM gives a dynamic screen resolution setting, allowing us to render at high resolutions that are then scaled down to the monitor. As a result, we get several tests using the in-game benchmark. For low-end graphics, we examine at 720p with low settings, whereas mid- and high-end graphics get 1080p Ultra. The top graphics test is also redone at 3840x2160, also with Ultra settings, and we also test two cards at 4K where possible.
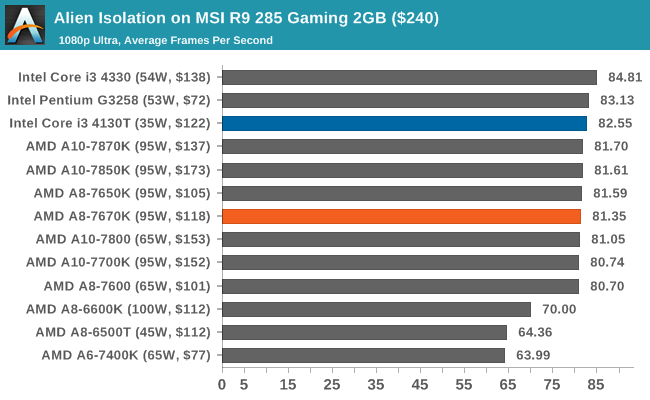
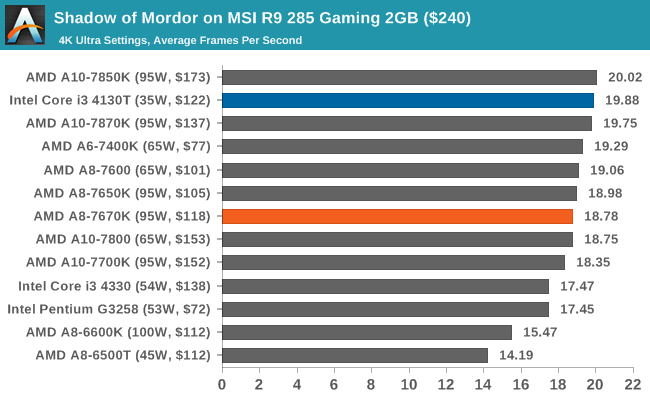
Gaming Benchmarks: Mid-Range
Limited-budget users who want to pair an APU with a midrange card might have $200 to $300 to spend on a previous-generation high-end card, or a current-generation "almost the top" offering. To that end, we run our tests with a GTX 770 Lightning (essentially a GTX 680) and an interesting member in an R9 285, which features AMD’s Tonga GPU microarchitecture.
Alien: Isolation
If first-person survival mixed with horror is your sort of thing, then Alien: Isolation, based off of the Alien franchise, should be an interesting title. Developed by Creative Assembly and released in October 2014, Alien: Isolation has won numerous awards, ranging from Game Of The Year to several top 10s/25s and Best Horror titles, ratcheting up over a million sales by February 2015. Alien: Isolation uses a custom-built engine that includes dynamic sound effects and should be fully multicore enabled.
For low-end graphics, we test at 720p with Ultra settings, whereas for mid- and high-range graphics, we bump this up to 1080p, taking the average frame rate as our marker with a scripted version of the built-in benchmark.
Total War: Attila
The Total War franchise moves on to Attila, another Creative Assembly development, and is a stand-alone strategy title set in 395AD where the main story line lets the gamer take control of the leader of the Huns in order to conquer parts of the world. Graphically, the game can render hundreds/thousands of units on-screen at once, all with their individual actions, and can put some of the big cards to task.
For low-end graphics, we test at 720p with performance settings, recording the average frame rate. With mid- and high-range graphics, we test at 1080p with the quality setting. In both circumstances, unlimited video memory is enabled, and the in-game scripted benchmark is used.
Grand Theft Auto V
The highly anticipated iteration of the Grand Theft Auto franchise finally hit the shelves on April 14, 2015, with both AMD and NVIDIA in tow to help optimize the title. GTA doesn’t provide graphical presets, but it opens up the options to users and extends the boundaries by pushing even the hardest systems to the limit using Rockstar’s Advanced Game Engine. Whether the user is flying high in the mountains with long draw distances or dealing with assorted trash in the city, when cranked up to maximum, it creates stunning visuals but hard work for both the CPU and the GPU.
For our test, we have scripted a version of the in-game benchmark, relying only on the final part, which combines a flight scene with an in-city drive-by, followed by a tanker explosion. For low-end systems, we test at 720p on the lowest settings, whereas mid- and high-end graphics play at 1080p with very high settings across the board. We record both the average frame rate and the percentage of frames under 60 fps (16.6 ms).
GRID: Autosport
No graphics test is complete without some input from Codemasters and the Ego engine, which means for this round of testing, we point toward GRID: Autosport, the next iteration in the GRID and racing genre. As with our previous racing testing, each update to the engine aims to add in effects, reflections, detail and realism, with Codemasters making "authenticity" a main focal point for this version.
GRID’s benchmark mode is very flexible, and as a result, we created a test race using a shortened version of the Red Bull Ring with 12 cars doing two laps. The player car is in focus throughout this benchmark and starts last, but usually finishes second or third. For low-end graphics, we test at 1080p and medium settings, whereas mid- and high-end graphics get the full 1080p maximum. Both the average and the minimum frame rates are recorded.
Middle-Earth: Shadows of Mordor
The final title in our testing is another battle of system performance with the open-world action-adventure title Shadow of Mordor. Produced by Monolith using the LithTech Jupiter EX engine and numerous detail add-ons, SoM goes for detail and complexity to a large extent, despite having to be cut down from the original plans. The main story was written by the same writer as Red Dead Redemption, and it received Zero Punctuation’s Game of The Year in 2014.
For testing purposes, SoM gives a dynamic screen resolution setting, allowing us to render at high resolutions that are then scaled down to the monitor. As a result, we get several tests using the in-game benchmark. For low-end graphics, we examine at 720p with low settings, whereas mid- and high-end graphics get 1080p Ultra. The top graphics test is also redone at 3840x2160, also with Ultra settings, and we also test two cards at 4K where possible.
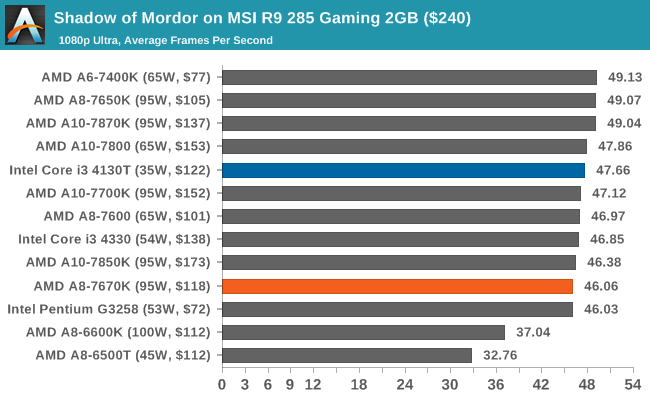
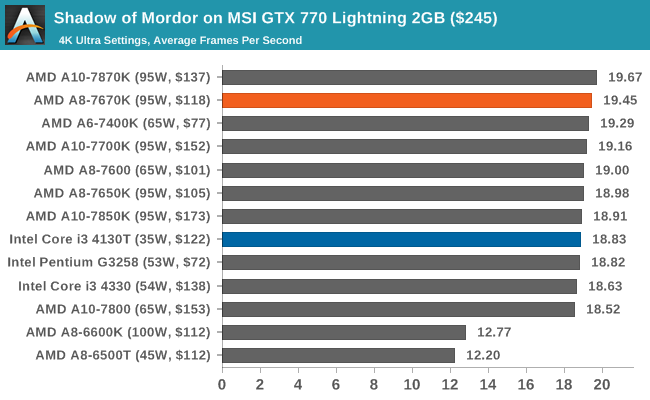
Unfortunately, our GTX 770 gave some odd results in SoM for 1080p. We're trying to get to the bottom of this, and it's an issue we've seen before but have never been able to pinpoint. It seems that a GTX 770 at 1080p performs better without an Internet connection, which is odd, or the problem could be something else entirely. More investigation is needed.
Rocket League
Hilariously simple pick-up-and-play games are great fun. I'm a massive fan of the Katamari franchise for that reason — passing start on a controller and rolling around, picking up things to get bigger, is extremely simple. Until we get a PC version of Katamari that I can benchmark, we'll focus on Rocket League, as recent noise around its accessibility has had me interested.

Rocket League combines the elements of pick-up-and-play, allowing users to jump into a game with other people (or bots) to play football with cars with zero rules. The title is built on Unreal Engine 3, which is somewhat old at this point, but it allows users to run the game on super-low-end systems while still taxing the big ones. Since the release earlier in 2015, it has sold over 5 million copies and seems to be a fixture at LANs and game shows — and I even saw it being played at London’s MCM Expo (aka Comic Con) this year. Users who train get very serious, playing in teams and leagues with very few settings to configure, and everyone is on the same level. As a result, Rocket League could be a serious contender for a future title for e-sports tournaments (if it ever becomes free or almost free, which seems to be a prerequisite) when features similar to DOTA on watching high-profile games or league integration are added. (To any of the developers who may be reading this: You could make the game free and offer pay-for skins or credits for watching an official league match – it wouldn’t diminish the quality of actual gameplay in any way.)

Obligatory shot of Markiplier on Rocket League (caution, coarse language in the link)
Based on these factors, plus the fact that it is an extremely fun title to load and play, we set out to find the best way to benchmark it. Unfortunately, automatic benchmark modes for games are few and far between. In speaking with some indie developers as well as big studios, we learned that, for there to be a benchmark mode, the game has to be designed with a benchmark in mind from the beginning, because adding an automated one at a later date can be almost impossible. Some developers seem to realize this as their (first major) title is near completion, whereas large game studios don't care at all, even though a good benchmark mode will ensure its presence in many technical reviews, increasing awareness of them and answering a number of performance-related questions for the community automatically. Partly because of this, but also on the basis that it is built on the Unreal 3 engine, Rocket League does not have a benchmark mode. In this case, we have to develop a consistent run and record the frame rate.
Developing a consistent run for frame-rate analysis can be difficult without a "trace." A trace ensures that random numbers are fixed and that the same plot occurs each time – the Source engine was very good for this when we used to have Portal benchmarks, or even Battlefield 2 did it reasonably well. But when a trace is unavailable, we have to deal with non-player characters that use random action generators in sports-like titles. When faced with a task, typically, an AI function will have a weighted set of options of what it should do, and then will generate a random number that usually does option A, but might do option B and, 1 in 100 times, does uncharacteristic option C. But we've had this situation of random AI tasks before. For example, any racing benchmark that uses the Ego engine — such as DiRT, DiRT 2, DiRT Rally, GRID, GRID Autosport and any official F1 title this decade — runs a race over a fixed number of laps, representing what can happen in an actual race. While you don't get the same frames being rendered, the overall frame-rate profile of a long benchmark run should have both high- and low-fps moments and end up similar when all possible variables you can fix are fixed. As long as you don’t look at the absolute minimum frame rate and report it, the averages (mean or median) and percentiles instead should align appropriately.
With Rocket League, there is no benchmark mode, so we have to perform a series of automated actions. We take the following approach: Using Fraps to record the time taken to show each frame (and the overall frame rates), we use an automation tool to set up a consistent 4v4 bot match on easy, with the system applying a series of inputs throughout the run, such as switching camera angles and driving around. It turns out that this method is nicely indicative of a real bot match, driving up walls, boosting and even putting in the odd assist, save and/or goal, as weird as that sounds for an automated set of commands. To maintain consistency, the commands we apply are not random but time-fixed, and we also keep the map the same (Denham Park) and the car customization constant. We start recording just after a match starts, and record for 4 minutes of game time, with average frame rates, 99th percentile and frame times all provided.
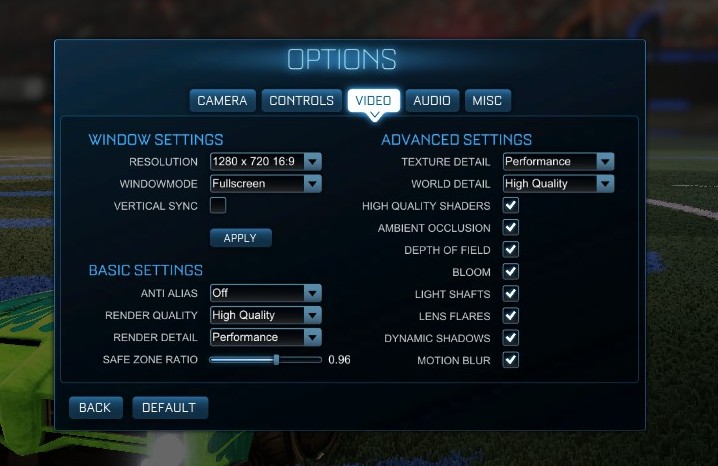
The graphics settings for Rocket League come in four broad, generic settings: Low, Medium, High and High FXAA. There are advanced settings in place for shadows and details; however, for these tests, we keep to these four. Actually, due to an odd quirk with Rocket League, in most resolutions, only Low and High will generate different results. The title doesn’t require much in the way of GPU resources at times depending on the resolution (720p vs. 4K), and in our testing, the FXAA mode for High gave the same results as High, while in any resolution below 1920x1080, the Low and Medium results were equivalent. Our initial tests went through all four generic settings at 720p, 900p and 1080p to determine what would be a good metric for integrated graphics settings.
At this point, it is worth mentioning a small quick issue with Rocket League regarding frame rates. By default, the game is capped at 60 fps for a variety of reasons, including game consistency and a hybrid form of power saving, allowing the system to sleep if the system can produce and dump frames. Removing this cap requires adjusting the TASystemSettings.ini file, and the AllowPerFrameSleep parameter to False. Doing this lifts the cap, although some users of earlier versions have reported some camera issues in certain configurations. Our testing has not showed any issues resulting from an uncapped frame rate. Also, there is now a way to force MSAA, although we are not using it for this test.
Thus, with our test, we did a sweep of 1280x720, 1600x900 and 1920x1080 at each of the four graphics settings, at 10 runs apiece. That's 120 games of football/soccer, at 4 minutes of frame recording each (plus 90 seconds for automated setup to load the game and select the right match). Because Fraps also lets us extract frame time data, we can analyze percentile profiles as well. The following results show each of the 10 runs at each setting, with a final average at the end (click through to see the full table in high resolution).
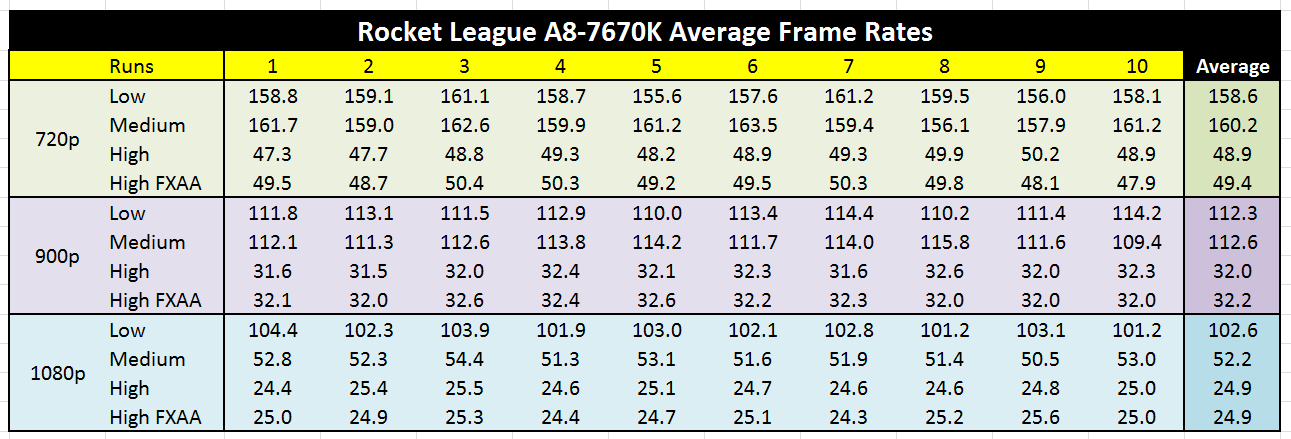
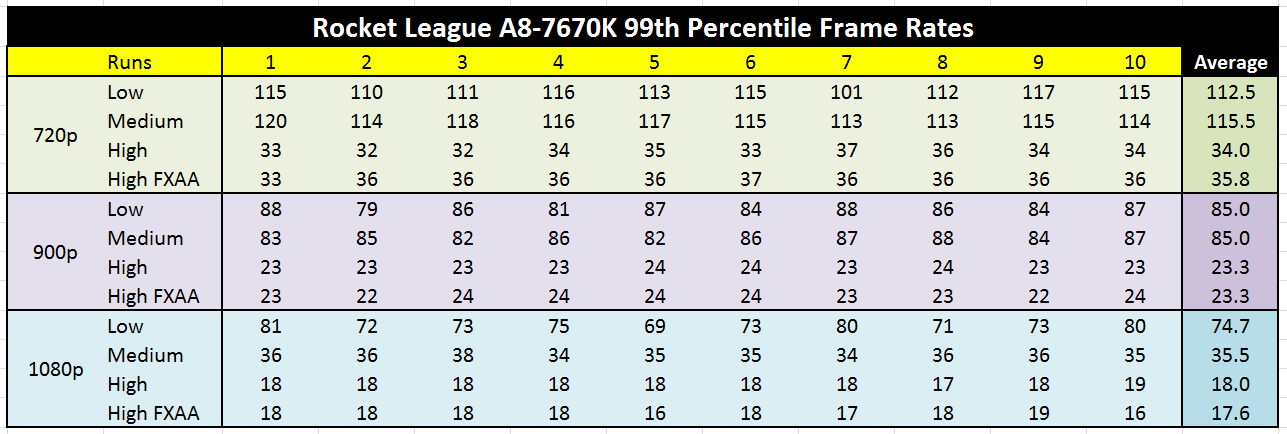
For most users, the golden value of either 60 fps or 30 fps matters a great deal, depending on the scenario. Currently, our game tests use settings designed to allow a good integrated GPU (or R7 240-like discrete GPU) to achieve either 30 fps on the average or 30 fps on the 99th percentile, with some approaching a 60-fps average. In this case, the integrated graphics for the A8-7670K feels best at either:
- 1280x720 High: 48.8 fps average, 34.0 fps at 99th
- 1600x900 High: 32.0 fps average, 23.3 fps at 99th
- 1920x1080 Medium: 52.2 fps average, 35.5 fps at 99th
Here's what these look like on a frame-rate profile chart, indicating where the frame rate typically lies.
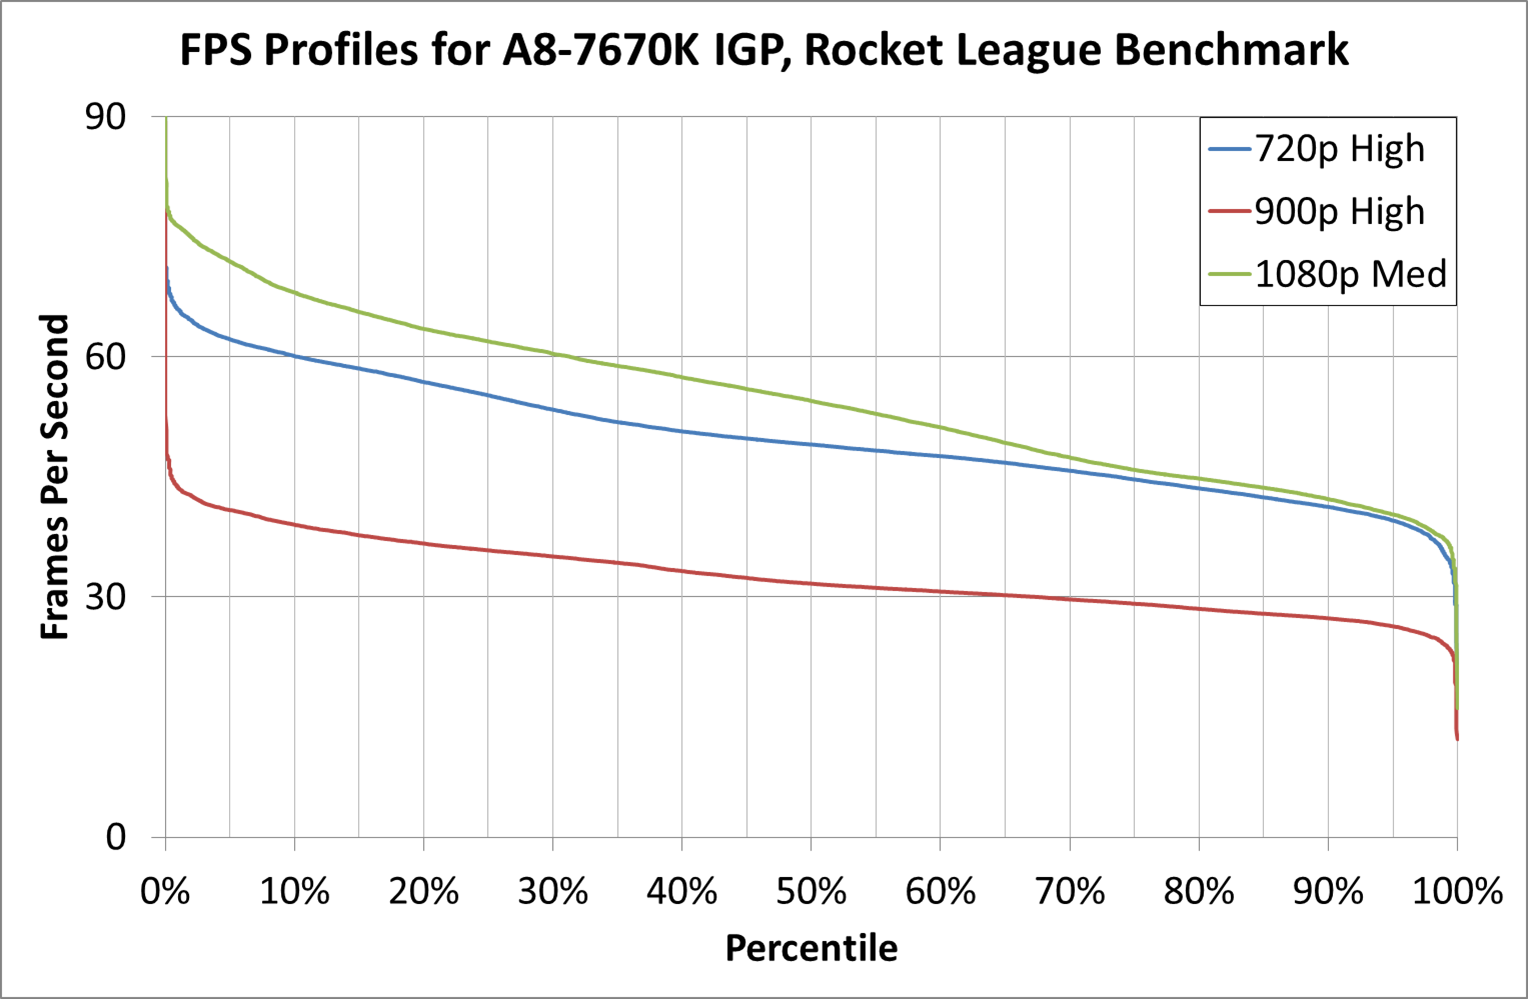
This graph shows that the 900p High line hits 30 fps only 67% of the time, clearly taking it out of the running. With the other two, we are comfortably in the 30-fps zone for just about the whole benchmark, but the 60-fps numbers are interesting — at 1080p and Medium settings, about 32% of the frames are over 60 fps, compared to only 10% of the frames at 720p High.
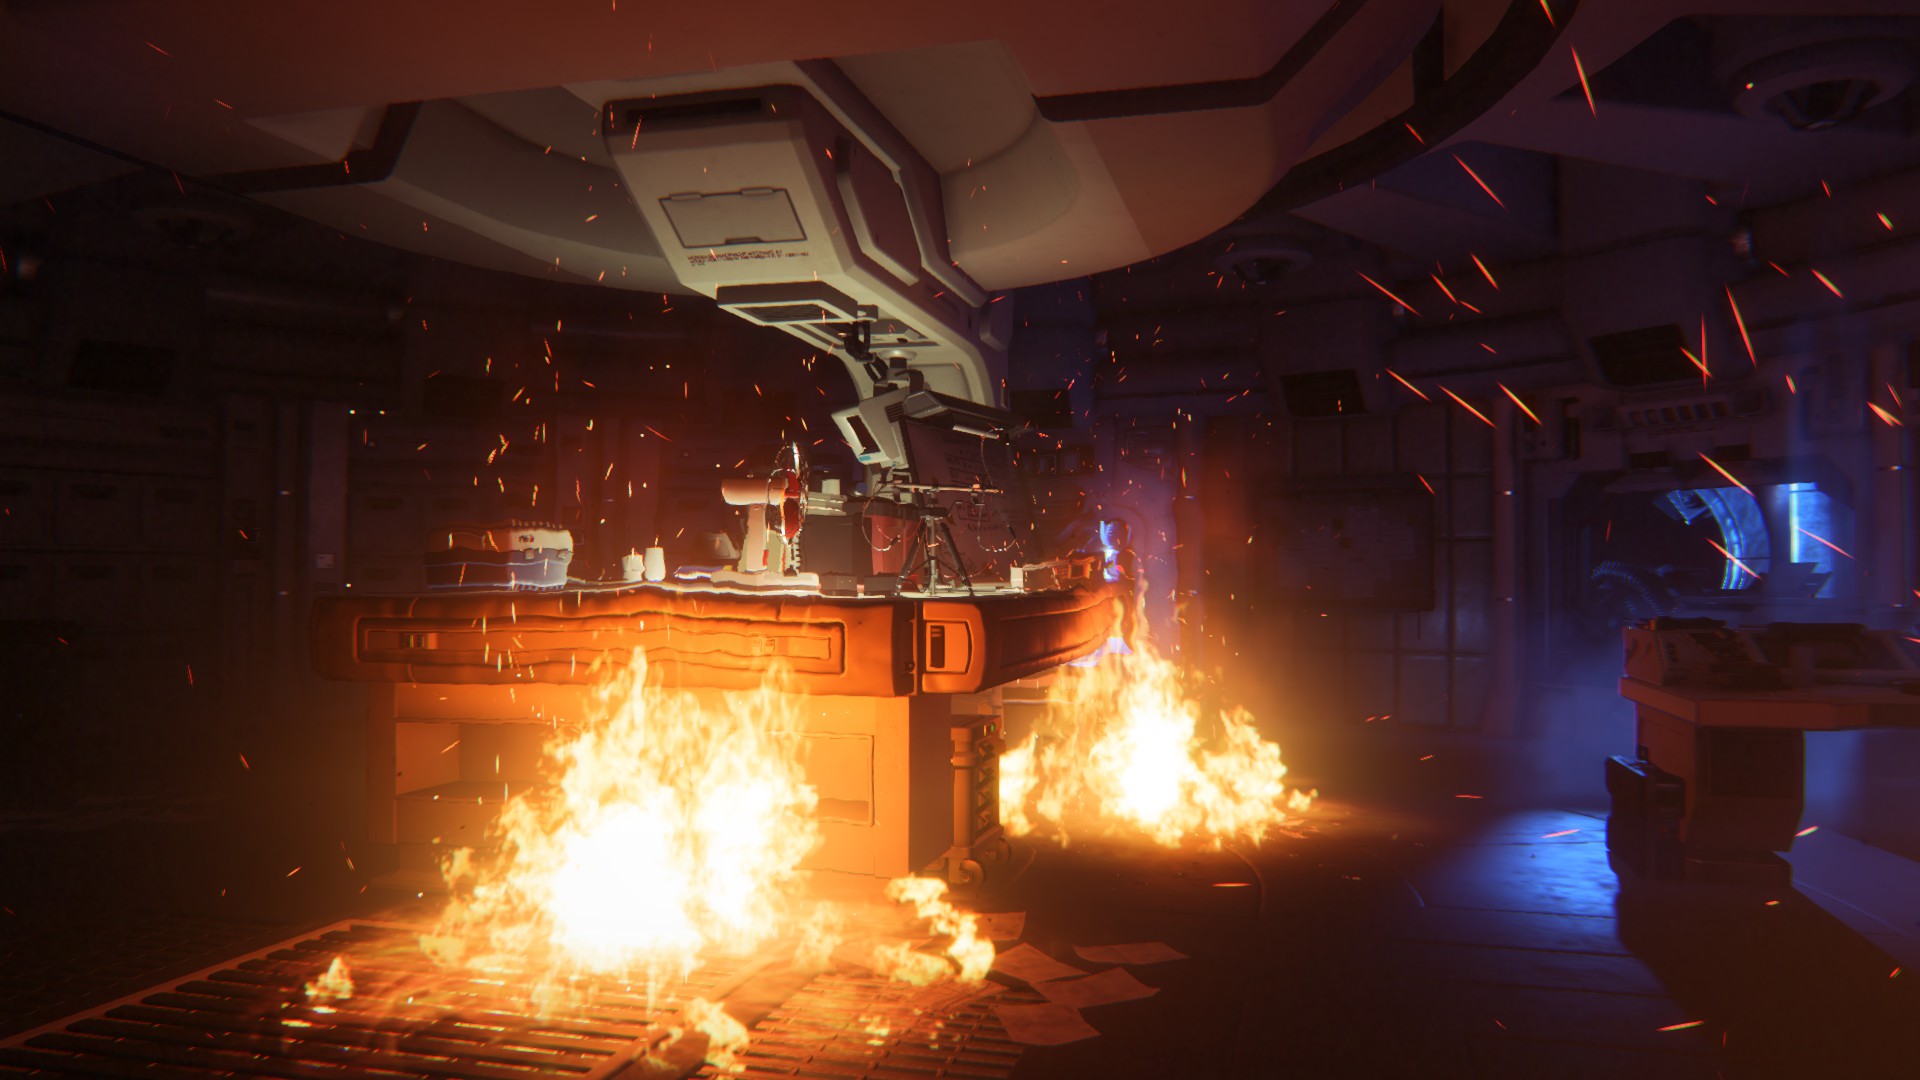
Numbers aside, look at the images below for quality and clarity, and see what you think. I've added in 900p as well, for completeness.
1280x720 High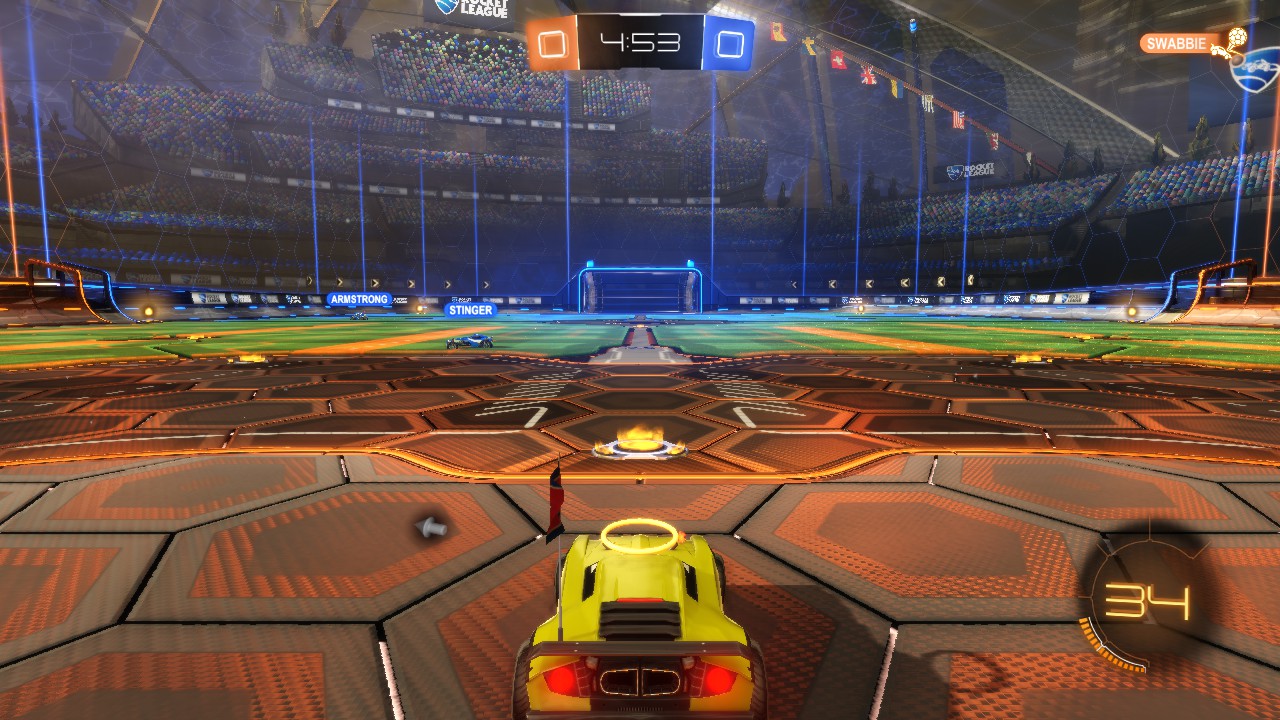
1600x900 High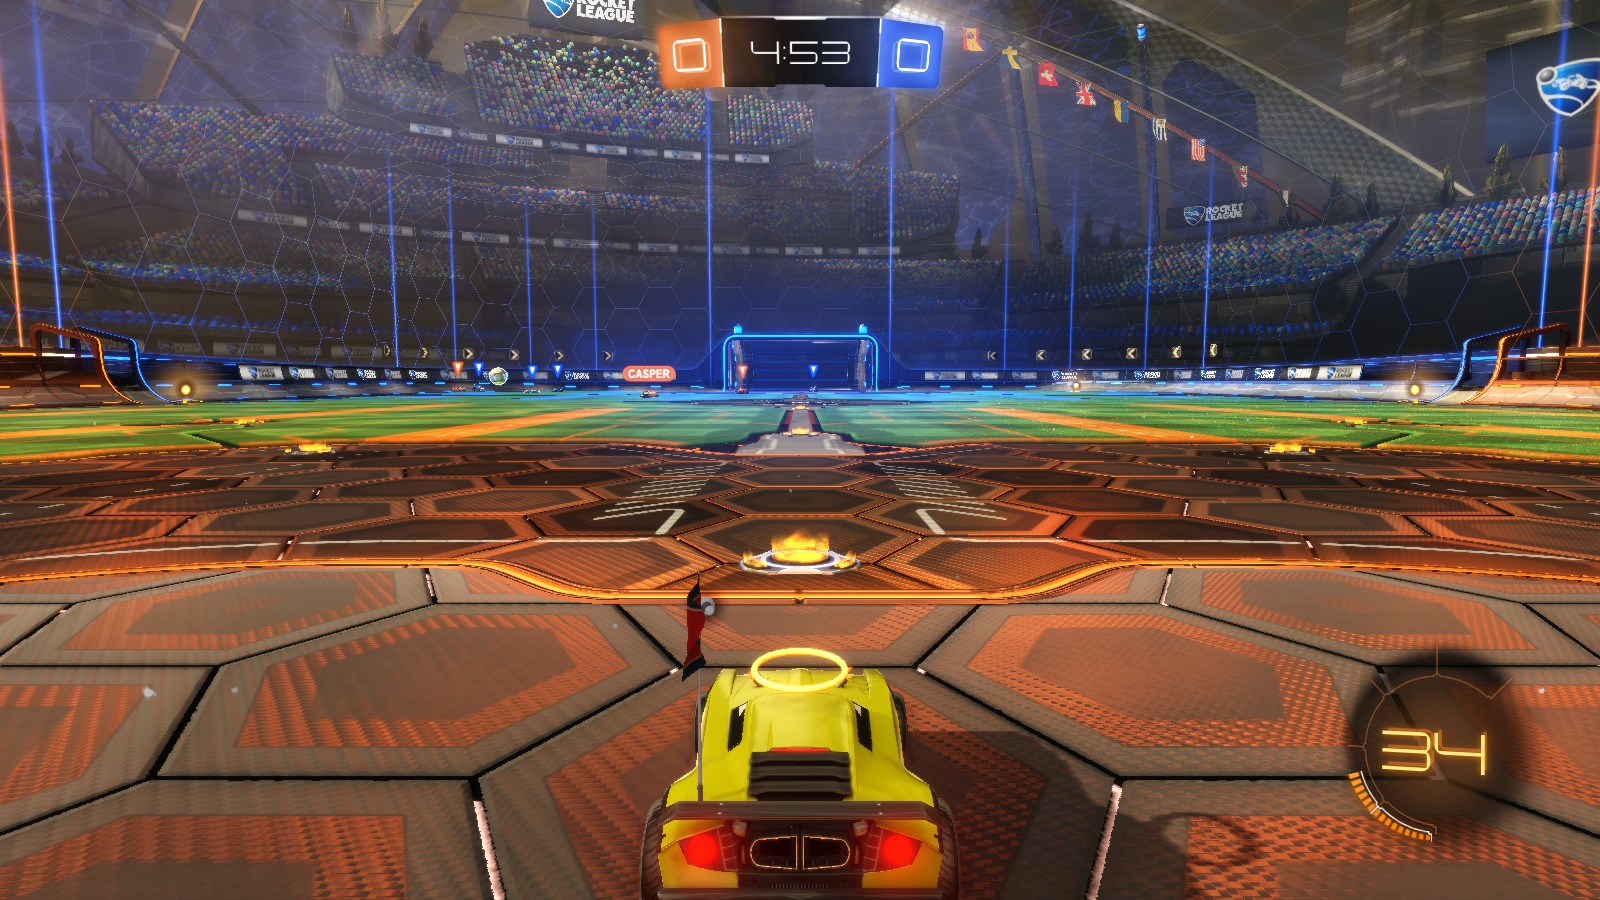
1920x1080 Medium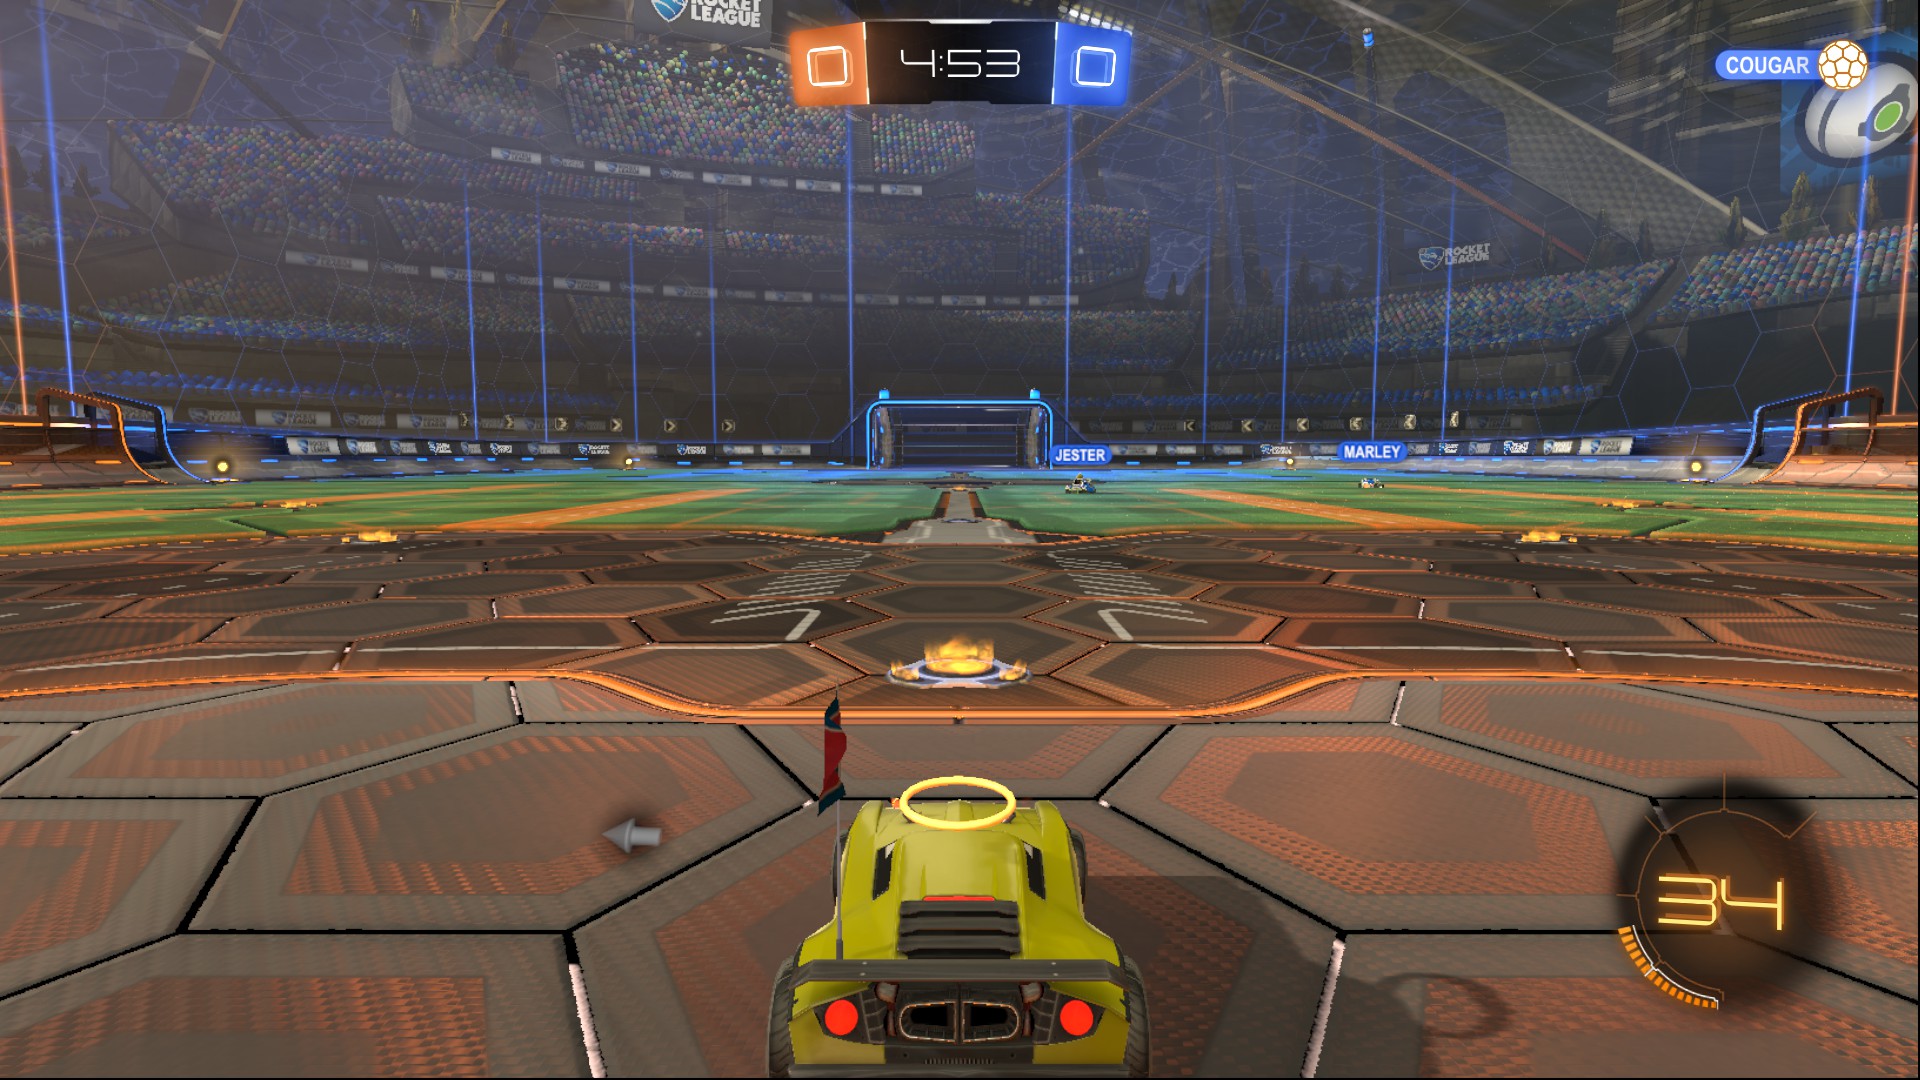
There's no doubt about it: At High settings, the game looks nicer. Colors and lighting are more vibrant. But this is countered by better edge compensation at the higher resolutions, making it easier to see what is in front of you at medium to long distances, as well as giving the game a smoother feel in general.
Because this is a new test, we are still testing it with other CPUs, and it'll make a full appearance next year in our 2016 benchmark update. But for now, we have an i5-6600 processor (one of Intel’s latest Skylake 65W parts for a future review) tested at all the resolution and graphics combinations. Here, we use both processors at their JEDEC memory supported frequencies (A8-7670K at DDR3-2133, i5-6600 at DDR4-2133).
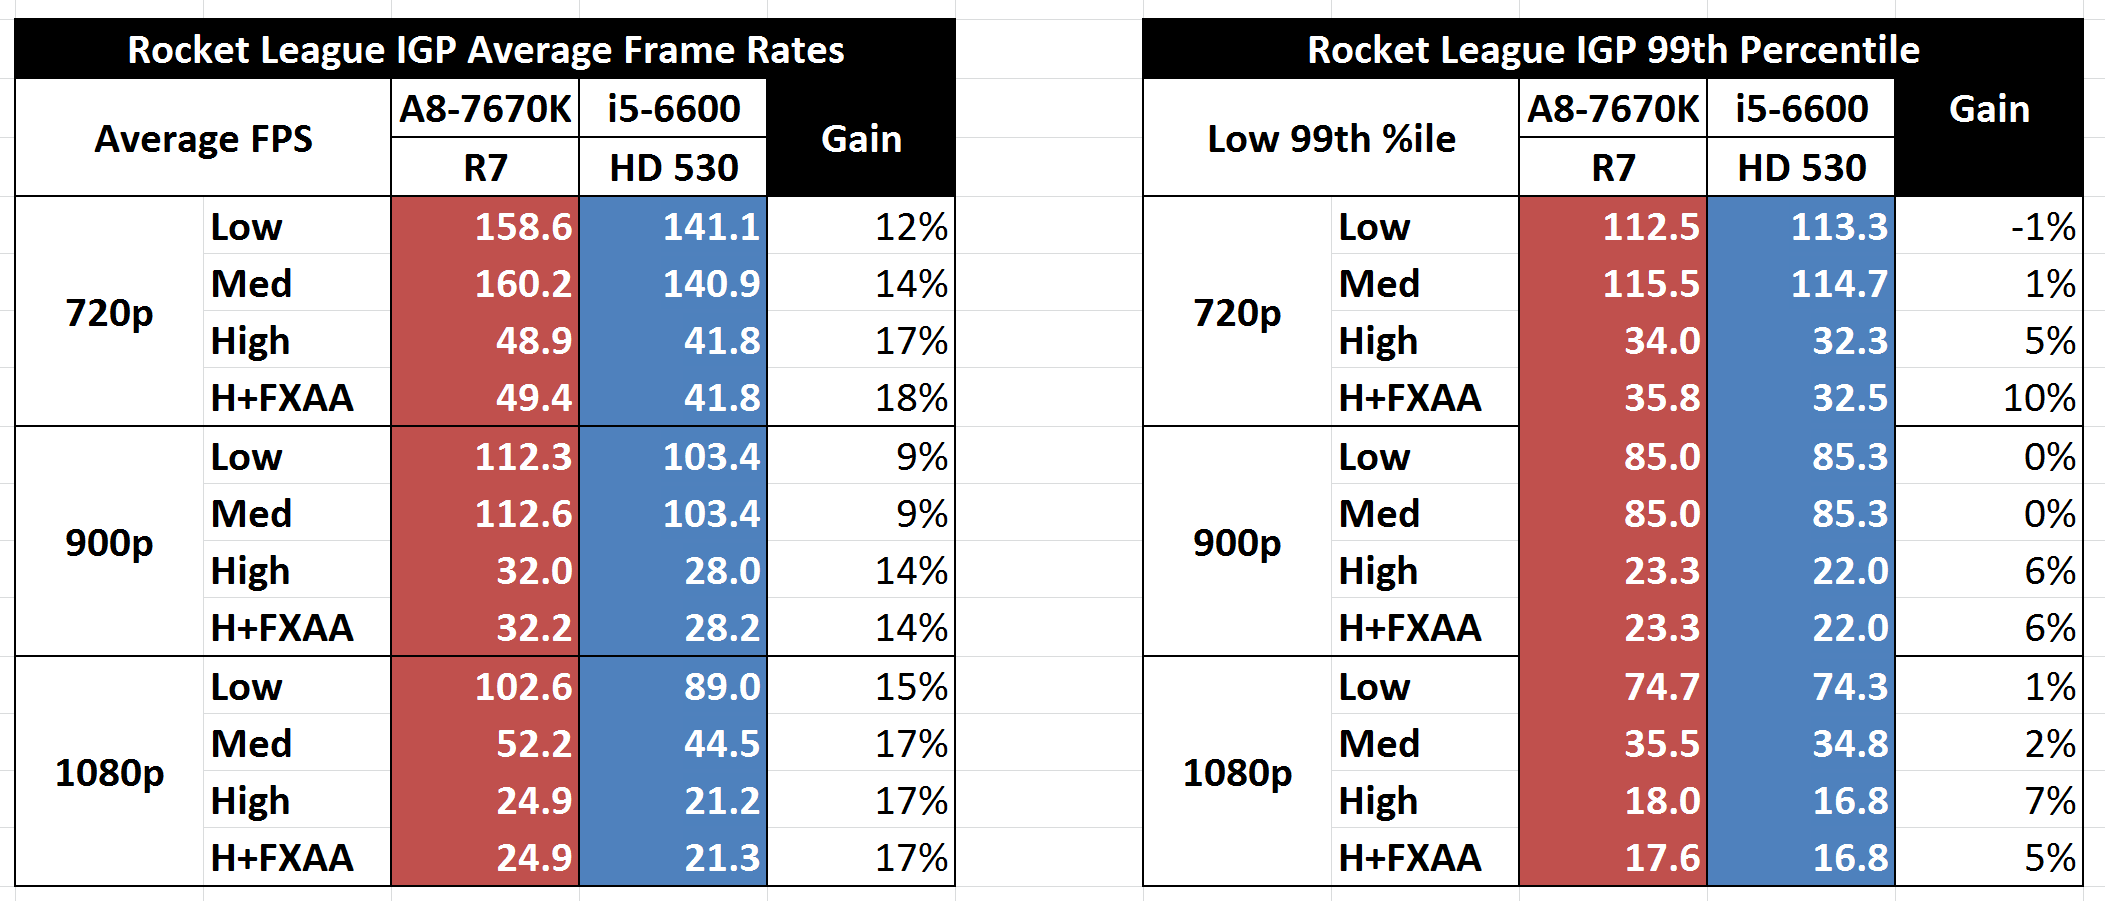
On average, the A8-7670K in this comparison produces 14% better frame rates, with 720p and 1080p getting the best jumps for the more strenuous graphics settings. The 99th-percentile figures also favor the A8-7670K — this time, by an average of 4% but still preferential when the graphics settings are moving from low to high.
For our 2016 CPU benchmark tests, it would seem to suggest that 1280x720 at High or 1920x1080 at Medium would most likely be our CPU-focused benchmarks on integrated graphics going forward. Unless enough 4K monitors come my way, then we can also add in some 4K High comparisons for extreme graphics situations.
AMD A8-7670K Conclusion
We have tested all of the new AMD APUs as they have trickled into the market, but there are a few obvious points that come up from comments and forums when we discuss them. To start, the base architecture in these APUs, though part of the Kaveri or Kaveri Refresh family, debuted in January 2014, making it nearly two years old. The underlying design that has been iterated upon three times for Kaveri — Bulldozer — is now four years old, released in October 2011. For all intents and purposes, because these processors are AMD’s latest desktop offerings, they are compared to Intel’s latest counterparts.
Despite AMD’s push into using their heterogeneous system architecture platform as a way to accelerate day-to-day tasks that involve any vector calculations (JPEG decode, video playback), as most benchmark workloads will show, the AMD APUs come out slower on the pure CPU aspect, and they're power-hungry due to the 28-nm lithography node on which they are produced (particularly compared to Intel's latest 14-nm node). I was at an event earlier this year where a technology journalist told AMD up front that they considered the 28-nm processors hot and slow, and that users were not likely to be interested in them.
To combat what AMD sees as an pervasive dislike of the platform, AMD has been focusing on three talking points in their marketing message in order to communicate the areas where they believe they have an advantage. This is, by its nature, a bit of a spiel on AMD's part, but at the same time, there are some nuggets of truth in these claims, as illustrated by our benchmark results.
AMD's first talking point is, of course, price. AMD considers their processors very price-competitive, especially for low-cost systems when you consider performance as a function of total system cost. AMD's second talking point is on the power-consumption issue. For some time now, AMD's line has been that they don't believe that most users think about power consumption when gaming, suggesting that for the markets they are targeting, it might not be an issue to begin with. AMD's third talking point is on graphics performance, where AMD believes that their integrated graphics (or dual graphics with an R7 discrete card) will easily win on price and performance, especially for e-sports titles currently favored by budget gamers.
For the validity of AMD's talking points, we can verify Nos. 1 and 3 with our benchmarks, dollar for dollar. Especially when a dual graphics profile for a game exists, the gaming performance will be better for the same price. However, one might argue that relatively few users use a PC just for games, and items such as JavaScript/HTML5 performance for social media interaction is also important, with this being the main barrier low-frequency APUs have to compete against (in comparison to equally priced Intel counterparts). As for talking point No. 2, it's debatable whether users really care about the power consumption of their system during gaming. A personal thought for this would be if the system fans were to spin up, then maybe it would play on the mind, especially if the system is being used to watch a film or play music. But typically, users concerned with this sort of power consumption tend to be over 25 years old and can afford to be more selective with their purchases, as opposed to e-sports gamers on tight budgets. Nevertheless, some users will wholeheartedly disagree.
Ultimately these points lie at the heart of AMD’s dilemma. On one hand, many users will avoid an APU due to specifications or experience, no matter the budget. On the other hand, AMD has a tight space to work in, but there are areas where their APUs hold an edge over Intel's CPUs. The trick for AMD right now is convincing skeptical buyers of this.
If we look beyond today’s review, everyone who cares about CPU performance is hoping that AMD's new microarchitecture in 2016, Zen, allows AMD to catch up to Intel in raw CPU performance. At present, AMD has released slides claiming a 40% increase in IPC for their new design. If AMD can deliver on their performance goals then this should significantly improve their standing as far as x86 CPU performance goes, though this will initially be aimed at the high-performance market. Otherwise for budget users or the e-sports crowd, we will have to wait and see what the Zen microarchitecture brings and how it will be implemented for APUs.
Until then, AMD's APUs still win for that Rocket League style of player, beating any equivalent Intel implementation at the same price. The A8-7670K, with a minor recent discount to $100, is essentially the center point of that APU stack, on AMD's latest process design tweaks. We overclocked our sample to 4.6 GHz, but your mileage may vary.
On a personal note, as you might expect, I build systems for my family. My father, who wanted an audio workstation, had a big enough budget to consider something with many cores and hyperthreading, focusing on low audio latency and a configuration that used software that took advantage of that. I've mentioned in these reviews that I outfitted my 15-year-old cousin-in-law with an APU and a discrete card for a small cheap dual graphics system that probably cost $400 or so. With it, he does school work, talks to his friends and plays a range of MOBA and MMO games without issues. He's rather happy with it.
For future reference, all of our regular benchmark results can also be found in our benchmark engine, Bench.


